I think I've been pretty clear on the "week Ahead" (this week) and so far what we've seen this week, although I'll admit freely the fact we have Window Dressing and the end of the quarter today, does leave some question marks as to what certain signals actually mean when they'd otherwise be pretty clear as there's obviously a higher probability for more than one motive until today's close.
SRTY has been doing excellent for me so when we saw the stage 3 top for the August cycle and predicted (as is the norm for this situation) a head fake move up with distribution in to it and then the market following HYG to stage 4 decline, it takes a pretty good deal of evidence to step away from a position like SRTY when the trend since the head fake move, typically the last thing we see in stage 3 before a stage 4 decline, looks like this...
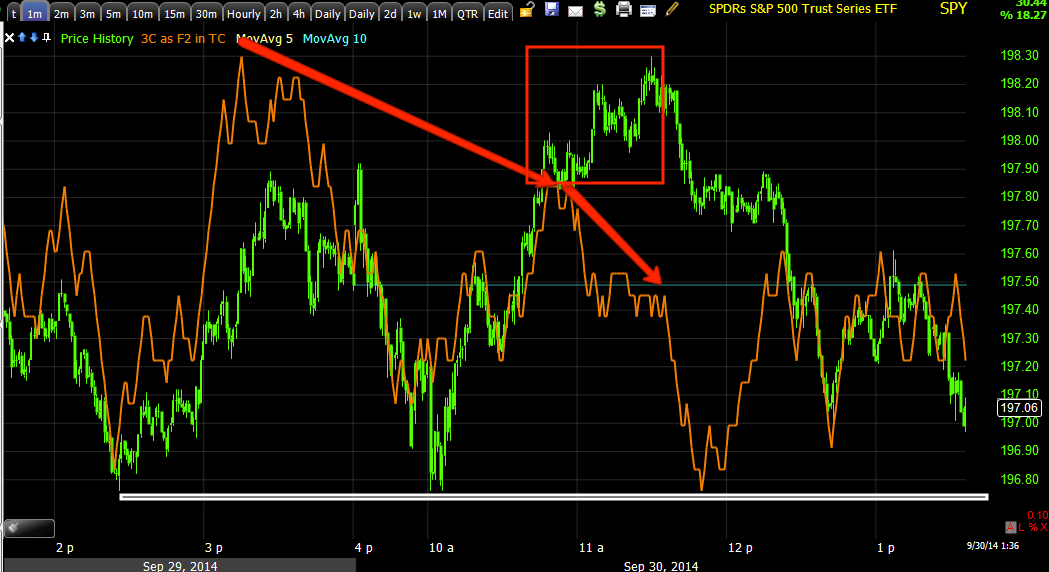
SPY stage 3 top followed by the transitional head fake move, a failed breakout and stage 4 decline with a series of lower highs and lower lows, or a downtrend which is of course the trend expected in stage 4 decline.
The IWM has an even longer trend to the downside, so obviously at this point, anything on the long side has to prove itself.
I started this post before the market started heading down just after 1 p.m. in anticipation of such an event as signals were pointing in that direction so some of these charts are going to be redundant now that we know their signals were correct, but the bigger point is still valid.
In Index Futures...
The 5 min futures usually need a positive divegrence before I'd consider any long trade, but this may be about more than just a long swing trade, it could be about the entries in certain assets, FSLR is one I'm looking at closely for a fill out position as it has performed well on the partial and really only needs a little bounce for a good entry, AAPL fill-out is another and on and on.
The other possibility is the pinning of the market because it may indeed just be that weak that the best close they can get for the quarter is right here and whatever support from 3C this week, has been to just hold the market in place to prevent a lower Q3 close, some evidence in market breadth is suggestive of that possibility, although it would be one of the largest consolidation divergences I have seen, which would make sense considering how bad the market looks on an continuing basis.
Again, there may be more than 1 motivation here or an unusual, unexpected one due to the end of quarter.
I was pointing out with this chart that the SPY is likely to see some lower movement today, it has already done that as I was uploading the charts,
this is what I wanted to see since yesterday because any accumulation to strengthen a divergence (positive) and lead us to a post Q3 corrective bounce, needs a stronger base than what it has now which requires price to come down, so that was the point in this chart's negative divegrence, the white trendline being the rough area of where ES/SPX futures would need to be.
I was pointing out the same in Russell 2000 futures.
And I was pointing out the same in the NASDAQ 100 Futures 5 min chart, their negative divegrence suggested a move lower to the trendline.
The 3C indicator would need to make higher highs as price makes lower moves toward those trendlines, none have met that lower target as of this moment.
The 15 min ES/SPX futures chart is just showing there's no positive, there may be a slight negative relative divegrence between points "A" and "B", otherwise distribution signals have been clear and solid forecasting.
ES/SPX 30 min is in line with the downtrend.
As is TF/Russell 2000 60 min, but there's the opportunity for a positive divegrence, although there's really not anything special there yet, but it wouldn't take much for the market to prove it to us before price even made a move.
Again with the QQQ intraday 1 min I was just pointing out the intraday distribution at highs and the probability of lower prices coming shortly.

On the QQQ 15 min chart I'm pointing out the same right now, but also the opportunity that such a move could create toward the lower trendline because the current base which essentially is only the white trendline, is not enough to do much other than hold price in place or maybe a slight bounce.
In other words, as we sit right now,
this divegrence is not a "NEW" opportunity creator, however it could be confirmation for existing shorts if the improvement doesn't show up.
The SPY intraday is also showing a negative intraday divergence which pointed toward lower prices, which are still being made as I write.
This is the SPY 15 min chart, it's divegrence area and what would be most useful, the green arrow representing price below or around the trendline (white) while the 3C chart moves like the orange arrow.
The yellow arrow is the new low expected early / Monday of this week.
The Custom TICK failed pretty quick intraday today.
Here's where it gets interesting... HYG has been used as market support, however, things are changing...
This is an intraday 1 min HYG chart, these flat ranges look boring, but they tend to have the most underlying action, in this case, distribution. Remember HYG's 3 min leading positive divgerence sent it higher as market support or a short term manipulation lever as it has been for months, even years.
Interestingly, this doesn't look like a fluke as there's migration of the negative divegrence intraday to the 2 min chart.
While this 3 min HYG chart's 3 min positive is what we have been looking at, on an intraday basis, and this is how all new divergences start ...
The 3 min chart on an intraday basis is seeing the same migration of the divergence, negative, which means it's getting stronger.
Again this makes me question motivations as this is happening in to the last few hours of Q3.
Our custom SPX/RUT Ratio Indicator has given out, not horribly, but it too was calling for lower intraday prices.
And High Yield Credit...
is not looking good.
The only other two leading indicators of interest at the moment are professional sentiment, are slightly positive in to the decline since 1, however not anything so strong as to be worth a screen capture.
The market is near the area where it CAN prove itself, or it can fail badly,
the timing we predicted for the week ahead was Wednesday, the first of the month so this would be the time to do it or darn close.
I also want to get an SRTY and especially SQQQ chart up, you'll see what I mean about the shorts being strong hands with weak hands shaken out as well as how incredible these two 3x inverse ETFS (IWM and QQQ) really look.


No comments:
Post a Comment