I wish I could have gotten the
Position Management & Trade IDea : QQQ/IWM post out sooner, but the pros come out at the end of the day and sometimes move indicators in the last 10 or 15 minutes. I needed to decide if this was a big enough move to not only temporarily close two of our best performing shorts (SRTY for sure one of the best performers out there), but also whether it was better to leave the proceeds in cash or to take a position and it wasn't an east decision, the signals are not as obvious after the fact.
I ended up deciding to close SRTY (temporarily) and SQQQ and rather than book the gains and stay in cash, to enter the reverse ETFs, TQQQ (3x long QQQ) and URTY (3x long IWM), but to do so in half size positions.
Given the risk reward profiles of both new positions and given the gains in the two closed positions, I can easily justify half size positions considering what SRTY alone has brought in.
If there are additional signals of more strengthening, I have room to add up to another 50% to bring these up to full size position which is what I'd like to see, but make no mistake about it, I'll be back in SQQQ and SRTY long likely within a week or less, they are where the long term trend is.
As for the IWM and QQQ in the decision making process, they weren't as helpful as you might suspect.
IWM
IWM 1 min intraday is showing a divergence, this is certainly
not the kind of divergence that would have caused me to take the action I took, although it is interesting and developing.
IWM 2 min has a leading positive divegrence, again, a nice migration from the 1 min chart, but not action worthy, especially not for selling SRTY.
Although this chart may look more bullish in to the end of the day, that was not obvious in the signal until at least 3:45 and then needed to be confirmed in multiple timeframes and multiple assets.
The 3 min chart is HARDLY inspiring enough to do anything whatsoever, so this had to be taken in to consideration.
And the 5 min chart, while positive and a clean divergence, it's not JUMPING off the chart, I'd normally say, "Give it a few more hours or a day". There's not much of anything beyond the 5 min chart.
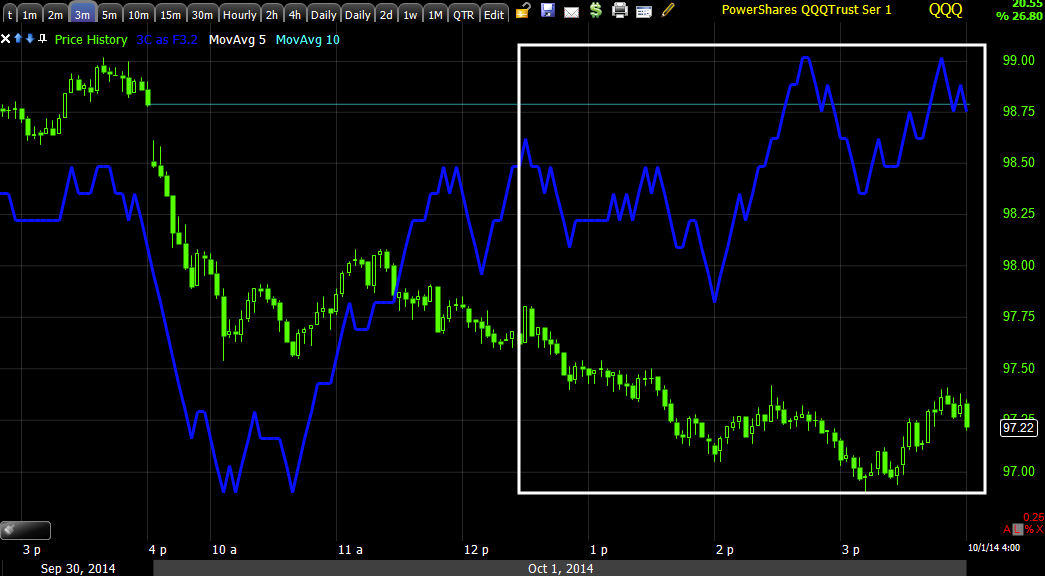
QQQ
The 1 min QQQ shows increased accumulation in to the EOD, again though, this was not apparent until at least after 3:30 and then still it's only a 1 min chart.
The 2 min chart is leading positive, but again, the extent was not visible until well after 3:30 today, around the time the pros come out in force.
The 3 min chart, like the IWM 5 min is clean, but it is still a 3min chart, not exactly what I'd wager a successful swing trade on.
And the 5 min chart inspires nothing at all...
As for the IWM itself and the August cycle, not only has it entered stage 4 decline, but is well through the start of the cycle at stage 1 accumulation, so again the concept of staging, "Knowing where you are to know where you are going" worked perfectly with HYG leading the market.
As for the 3x long ETFs bought (50% of full size positions), TQQQ and URTY (3x long QQQ and 3x long IWM respectively), they didn't quite solve the puzzle either.
TQQQ
The TQQQ 1 min chart went from a steady positive divegrence to a sharply leading one, however, once again this was late in the day before becoming obvious enough to warrant some attention.
As you can see, the TQQQ 5 min chart is not nearly enough on its own to inspire the confidence to take on a position here, although I had other reasons, this is one reason I held off at a 50% size position for now.
URTY
The URTY 5 min chart wouldn't cause you to buy anything.
While the 2 min chart did show some progress, on its own, it's not enough to buy anything.
This is what grabbed my attention as the leveraged ETFs are usually the first to show a signals and the most defined signal, I suppose because of their leverage.
Remember the point I demonstrated yesterday, the shorts in place are strong hand shorts, not easily run out of positions.
SQQQ
The 1 min leading negative divegrence in SQQ grew quite extreme at the end of the day.
This had migration to the 2 min chart leading negative as well and at the time the pros trade the market. There were some other signs, but SRTY grabbed my attention...
SRTY
The 1 min chart has a steady negative divegrence, on this timeframe it looks like short term profit taking.
On the 2 min chart it looks a bit more serious than just profit taking.
And on the 5 min chart, it was more than convincing as it led to a new leading negative low and most of that occurred in the last hour of the day.
All in all, I think it was a good decision, maybe a little quicker on the draw than normal, but we had expectations coming in to today which included the kind of price action and accumulation seen.
However, just as a reminder, I will be back in SRTY and SQQQ very soon...
SRTY 30 min positive and still in line confirming more upside in the days/weeks ahead.
And SQQQ 60 min with an enormous leading positive divegrence/base . These are ultimately where the money is at, but in the near term, I think we can turn over some gains and compound and still be back where we need to be in time to use those extra gains for larger positions


No comments:
Post a Comment