While it's way too early to make assumptions about the rest iof intraday activity, the early picture was interesting as it was very close to a Key 1-day reversal which is a strong reversal signal of a trend, also known as a reversal day, and a few other names, but the main components are a new high in the trend with a close which some define as near the lows of the day, but I prefer the textbook definition which is a close below the previous day's intraday lows which is a little different than a bearish engulfing candle as that only need to close below the real body of the previous day rather than the low which is not always one and the same.
*This is not the only potential Key Reversal Day , the early SPY and QQQ action look reminiscent of such a day as well, although it's a bit hard to imagine in front of the ECB tomorrow, even though consensus is the ECB has a lot of bark and no bite and after yesterday's near mutiny against Draghi, it's almost as if a signal was being sent just as the F_E_D sent a signal to the ECB last week at the F_O_M_C as the Euro slid right at 2 p.m., the message, "Don't go too far" and we "Noticed" the slide in the Euro.
In any case, that's what watching intraday trade and signals is all about, but their may be a trade idea coming out today in this and if some of the opening/early action is any indication on top of what we already know, numerous other assets.
The early daily candlestick chart for IYT/Transports...

Volume should also increase on a key 1-day reversal .

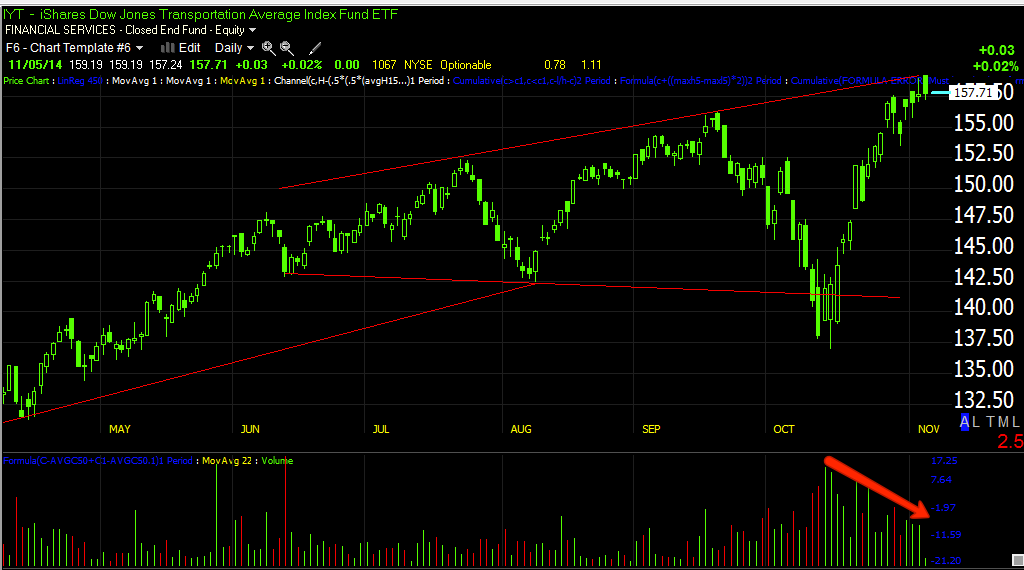
Note volume in to the latest run as the move tags the upper trendline.

Remember that it is very common to see price get very volatile after a Trend Channel stop out. The point of the trend channel is to capture the easy money or the trend, the 80% move before volatility is introduced. I've found over many years of using the Trend Channel as it was the first custom indicator I created that received an award (before 3C), that you are usually best off stopping out at a Trend Channel break, while higher prices in a volatile topping pattern are almost always available, nailing them is almost a matter of luck and more often than not, by the time the top resolves and the way in which it resolves, you are almost always better off taking your gains from the trend off the table and either putting them to work somewhere else or in cash, in other words, from experience, "I prefer to take the gains and leave the volatility and fractional potential gains to someone else".


I'll have more as it develops, but a 1-day key reversal with this kind of price pattern and trend would be an amazing entry.


No comments:
Post a Comment