TWTR looks exactly like a stock that is behaving as if it were in a bear market rally, I've talked about these numerous times, it's one of my reasons I think bear markets are the fastest way to make money as fear is much stronger than greed, falling 2.5 to 4x faster than a bull market rises on average and the bear market rallies which can be seen a mile away are SOME OF THE STRONGEST RALLIES YOU'LL EVER SEE...The reason is the exact same reason the October rally had to be so strong as sentiment was near all time lows, everyone calling a bear market with the Fear and Greed index (0-100) pegged at zero for consecutive days. In other words, to overcome that sentiment and actually get retail to buy, because in a zero sum game someone has to lose for someone to win and you can't have everyone on the same side of the trade such as it was at the October lows, the rally has to be overwhelmingly impressive, not just to overcome the bearish sentiment, but to get retail to be wildly bullish again... teaching them a dangerous lesson about buying the dip. Even in a -10% decline, the dip should be bought which is like the Army Captain who came across a minefield and decided the best course of action was to close his eyes and lead his troops across. The fact they survived teaches a fatal lesson for the next time they encounter a minefield.
For the most part my gut feeling they'll try to pin TWTR to this area in to the close although there looks to be some fairly heavy intraday profit taking,.
Here's a broad look at TWTR, not EVERYTHING is roses...
It's difficult to see now because of the limited chart history, but there's a lower high, if TWTR makes a lower low, for all intents and purposes TWTR is in a primary downtrend.
The volume at the red arrow is bearish churning, the volume at the white arrows is bullish intermediate capitulation/selling climax.
Possible TWTR buy signal, 1 indicator off, but still pretty far off. The last two signals were effective.
TWTR long term 4 hour macro trend accumulation around April/May and a move up in to very strong distribution. There's another accumulation area to the far right (just passed), this looks like a counter trend rally.

To the left 3C accumulation at the last selling climax where shares are abundant to fill institutional orders and cheap, however at the negative divegrence in the middle, this is seen on a 4 hour chart, this was VERY serious distribution of TWTR.
Again to the far right an accumulation zone just passed.
On a 5 min trend, again the top/distribution was exceptionally strong, not like a typical wave down for a constructive pullback. To the right the accumulation zone mentioned, judging by both sizes, I'd say this is the equivalent of a bear market rally even though TWTR doesn't have enough history to create a primary downtrend yet- it is very similar to the market at the October lows.
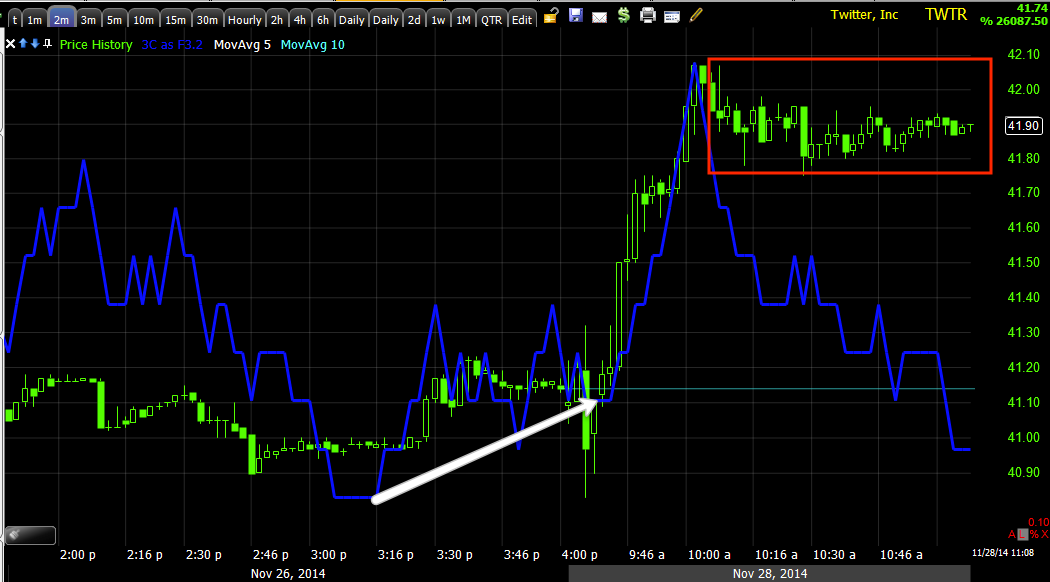
Recent intraday charts with what looks like market makers/HFTs perhaps accumulating Wednesday afternoon for today's move. Thus far this chart is holding which is why I think they'll pin the close around here, although some heavier sell side volume is picking up.
Intraday 3C is showing distribution which is just passing the normal profit taking on a move like this.
This 1 min chart "looked" like it was going to support with an intraday divergence, that fell apart.
And the 2 min chart is looking worse right now.
I checked several other indicators and versions of 3C to see if there were stronger signals standing out.
Again a lot of damage at the last pivot macro high around September and recent accumulation, but looking VERY much like a bear market rally does.
30 min chart showing the same as the 30 min above.
Despite the September damage, this 15 min chart's accumulation is plenty strong enough to continue a strong bear market rally, however as impressive as these are and they are the most impressive rallies I think I have seen outside of a short squeeze which has its limits... They are there for a reason. Look at the 1929 Dow's first bear market CT rally after the initial break (before you'd have known it was moving to a bear market.
Again intraday it looks like profit taking is heavy and by Monday this may be something more than profit taking.
However since there's such a large recent accumulation area I don't see the rally ending soon although it may get very volatile especially with not so great media out on TWTR users.
Remember how quickly the star stock of the decade AAPL broke at all time highs once Hedgies found out Dan Loeb got out.
The tightest Trend Channel is holding with a stop at $41.50 on the close.
For the length of this move, this is the channel I'd use for now, stop around $40.85 to $40.90.
I'll update this Monday and if you need an update sooner email me.
While I think a CT rally is VERY likely, I don't think this ends well for TWTR.


No comments:
Post a Comment