Here are some additional charts after having looked around a bit more while I wait for the morning averages to go through their normal morning games and start posting some reliable information.
While I believe TLT looks like it needs the most work to reverse what I'd call a pullback (actually a lever for Wednesday's move), the 30 year Treasury futures seem to be moving at a faster pace of repair.
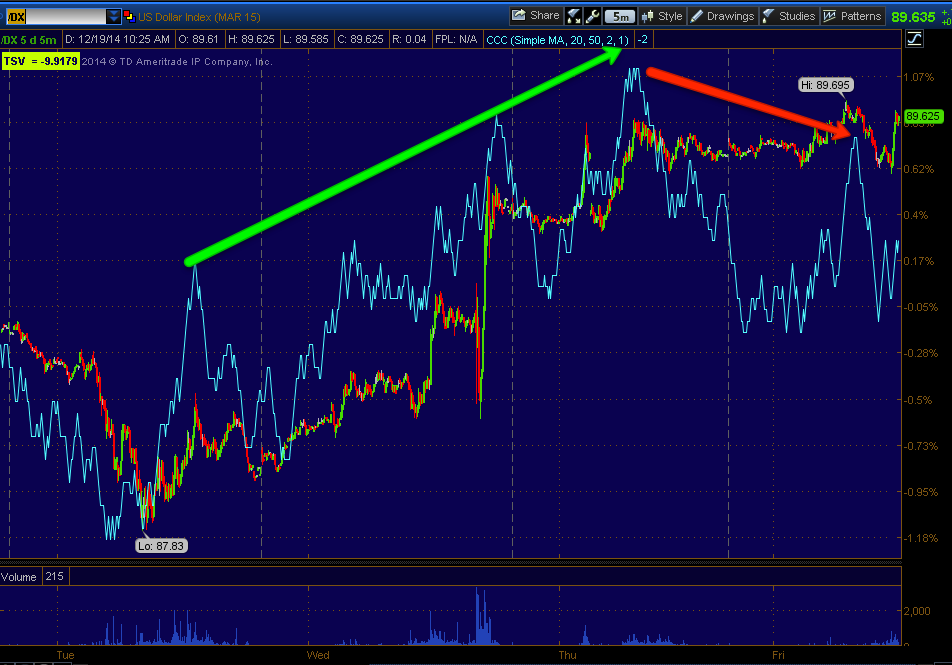
USD/JPY is probably just about the last ramping asset of use and the $USDX and Yen futures keep moving closer and closer to a downside reversal there.
I also looked at some longer Index future charts and realize just how much damage has been done to them (distribution in to price strength just as Monday/Tuesday's accumulation in to price weakness powered through the strongest short squeeze in 3 years on Wednesday, mostly small caps meaning mostly the Russell 2000 as expected.
This morning's price action is far removed from the last 2 days and looks exactly like the type oof percentage gains/losses expected for an options expiration maximum pain pin to ensure the greatest dollar amount of options expire worthless. The bottom line is that all indications continue to move along the expected path to completing a Crazy Ivan shakeout / head fake move in the market which sets the bull trap and downside momentum to carry on last week's move down in the markets.
Charts...
30 year Treasury Futures


I looked at the longer 15 min charts for Index futures as they have a cleaner underlying trend, less detail, but a clearer picture and found as expected, underlying weakness/distribution in to the price move, which is part of the confirmation of a head fake move or Crazy Ivan shakeout being the specific type of head fake move.


This is why I say, "If we keep on this trajectory at this pace, we could be looking at a very nasty move down by Monday", which would also tie perfectly in to my theory that this move would be used to draw traders in to what they think is the Santa Claus rally (the last week between Christmas and the New Year in anticipation of the January Effect.
If we were to see a sharp reversal early next week, the expected Santa Claus rally will have failed, leaving numerous longs at significant losses as they will buy the Santa rally just out of expectation that it will be there every year like clock work.
A very interesting potential set up / Bull Trap.


No comments:
Post a Comment