As far as the scenario discussed, I think it's still on the table but will need a lot of help.
The averages are trying to get something together.


Despite credit falling apart, the lever HYG is also being bid and there's no reason for them to do that unless they are planning on trying to get something going and I still think the faux Santa Claus rally is the best probability, although we need to see more evidence before it can be trusted.
We expected gold to be hit, see last week's and last night's post re: futures, thus I have kept the gold/GLD short open, today GLD was down over 2.5% on volume, making our charts look pretty good.

Silver was hit by more than -5% today as was oil at nearly 4%, thus the speculative call position, but the charts there are working on something and today may just have caused a short term oversold flame out.
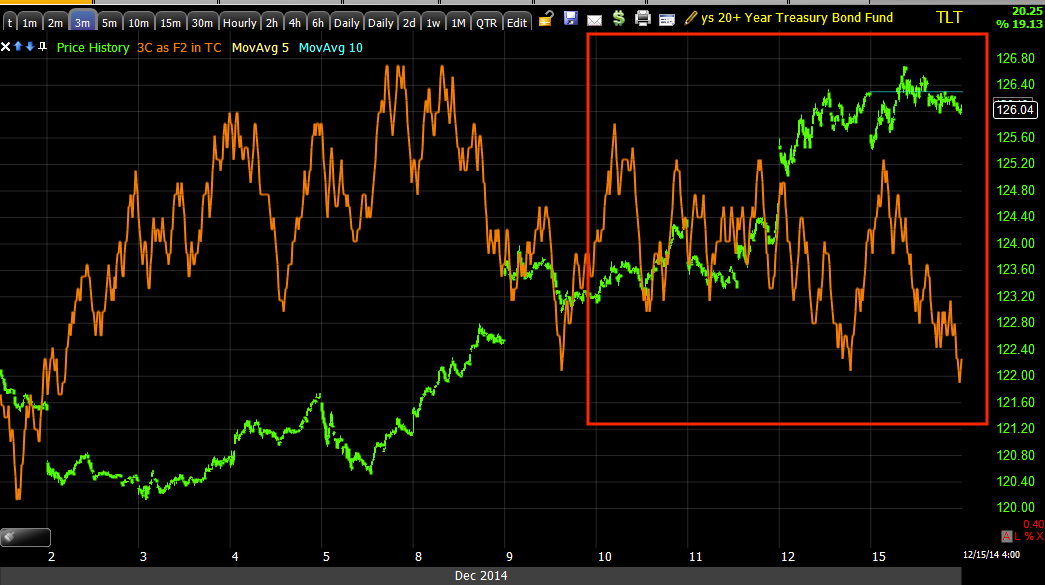
Treasuries were hit and yield curve flattening continues.
The SPX broke some of those levels I mentioned that may cause some short term hang-ups like the 50 and 100 day m.a. today. I think the market will try to find a toe hold in the area, especially as oversold as some indications are, but this is real selling, not some dip for longs to buy.
While it lightened up a bit toward the end of the day...

The fact is we were hitting NYSE TICK levels of -1850 which is about as extreme as you get.
Just to give you a bird's eye perspective of how bad this selling is and how much damage it is doing to market structure, the pilings that hold up the pier...


However there are some signs of a short term oversold event that can possibly get a toe hold if all the levers do their job. For instance, NINE OF NINE S&P SECTORS CLOSED RED TODAY WITH INDUSTRIALS PERFORMING THE BEST AT A LOSS OF -.33% AND HEALTHCARE PERFORMING THE WORST AT -.92%.
Amazingly only 35 of 238 Morningstar groups/sub-Industry groups closed green today!!!
There wasn't an outright Dominant P/V relationship today, but close. The Dow was Close Down/Volume Down with 14 stocks, everything else was Close Down/Volume Up, which is a short term oversold condition, although not that dominant. The NDX had 59 stocks which is dominant, the Russell 2000 had 818 which is dominant, but not that impressive and the SPX had 202, again dominant, but not that impressive and not all 4 averages shared the same relationship which may be reflective of only the IWM needing to make the move I mentioned, the others can lag with worse relative performance or even be red!
As for the levers...
As already posted, my two custom indicators the SPX/RUT ratio and the VIX Term Structure are both supportive of near term/short term higher prices.


I suspected we might see something along these lines after spot VIX's Friday closing candle forming a momentum losing Star with long legs.
The VIX closing lower on the day was strange as well with most of the averages down between 0.60 and 1+%.
There was nearly a VIX sell signal in the Bollinger Bands.


Someone is up to something and I wouldn't be surprised if our thesis re: the Santa Claus rally and then pulling the rug from under it wasn't close to the mark. Of course we do have the F_O_M_C meeting starting tomorrow and wrapping up with the policy statement on Wednesday, so that's something to look out for too as many "expect" the "Considerable time" language to be dropped from the statement and there were very clear cues from the F_E_D that they will not rescue the market, although we know they'll do something as to not have the economy and banking system fall in on itself, as I say, the Plunge Protection and Market Correction Team making sure money is transferred from the average Joe to the banksters.
One of the most obvious and go to levers for short term manipulation is HYG, remember the end of day selling settling down on my custom TICK indicator as they went for VWAP in to the last 2 hours of the day today, well take a look at HYG's relative performance vs the SPX.


Other HY Credit underperformed, but not to the extent it has been recently, it was closer to in line.
Even the Pro sentiment indicator that has been in sell mode just about as long as I can remember was in line today.


Very short term this is helpful for the market (5 year up), but curve flattening is very ugly for the market.


As for futures right now, The Index futures intraday look pretty good, but it's a long night, The Yen looks a bit negative which may push USD/JPY up and help Index futures.


On 5 min Futures charts, everything is about in line, only the Yen looks a bit weak, but on 7 min charts..
The Yen looks weak again, another helpful lever in USD/JPY up. Gold is about in line so I don't expect a bounce to lead to much and will stay short there for the time.
Crude has a nice positive divegrence. 30 year Treasury futures are in line with TLT with a negative divegrence, which is another helpful market ramping lever with 30 year yields moving up

And all Index futures are positive on the 7 min especially the Russell 2000.

While there are some divergences on the 15 min charts like 30 year treasuries negative, one of the more impressive is ES/SPX futures again with a positive.

I've said since late last week I think something is coming up on us and Saturday I fleshed out a scenario, I still think form a mass psychology point of view, using the Santa Claus Rally against traders who initially think it has kicked in, would be an amazing upset as they feel they are entitles to it and take it for granted as a done deal. That in my view would be the best use of an IWM head fake move, or the Crazy Ivan move in IWM, which has put in the first half or first 1/3rd of the move today.

IWM breaks 6 week range for the first time and on VOLUME!
Yes indeed, I think something is going on, but internals are clearly showing this is not going to end well as market breadth is almost as bad right now as it was at the October lows and we still have a ways to go before we hit those, it could be a speedy trip down to them off a head fake/bull trap.
I'll check futures again tonight, but I think we are on to something. As far as the question, "Would I trade this long as a piggy back trade?" As of now my answer is no, I'd use any price strength to short in to , let the trade come to you, but if we get stronger data, I may revise that position to include speculative longs.
Oh and SKEW is up again tonight, at $135, the Black Swan Index is in the red zone.


No comments:
Post a Comment