As of last Friday, it was apparent we were seeing the same kind of negative action we saw the previous Friday leading to a smack down on futures open last Sunday and a parabolic drop last Monday on the open that had created a short term oversold condition (high volume on a parabolic drop) by the first hour, by 10:30 last Monday we were already anticipating an oversold bounce which occurred most of last week with the RUT leading as we predicted and QQQ lagging also as predicted with all of the usual suspects as the levers which failed in to the end of last week.
Some notable posts from Friday included:
The morning's 9:25 a.m. A.M. Update which ended with,
"In addition to the same 5 and 7 min negative divergences seen late Friday last week that led to the sharp decline when futures opened Sunday night and the cash market Monday morning, this in addition to the various other timeframes posted last night as well, it seems we have another full house of negatives across the futures..."
It was clear from the a.m. that the market was starting to fall apart. Posts after that on Friday that just made the case stronger included:
At 10:47 a.m., IWM & QQQ Short are looking very interesting here "with the Q's having just made their intraday highs minutes earlier."
Quick Futures Update, "It looks like the market is about to come down, remember today is an op-ex Friday so there is a pin range most likely until about 2 p.m.
In any case, the Index futures intraday charts are starting or are continuing to look weaker ..."
Index Futures' 3C charts moving lower "This afternoon could get very interesting, as for right now , along with the last update, ES, TF and NQ (SPX, Russell 20000 and NASDAQ 1000 futures) are seeing significantly worse intraday deterioration, I wouldn't mention it if it were not of note."
Index Futures Like Last Week "Again those same divergences are in place. With the larger picture divergences shown again last night, I don't know how anyone could possibly ignore them unless they haven't seen the ability of Leading Indicators to give signals, in this case they are literally off the charts, larger than seen previously.
I'll remain short, remain patient and add where possible when possible."
And the Yield Curve continued to flatten today with Yields on the long end falling 5-7 bps and on the short end falling 1-2 bps, again...FLATTENING the curve which some people claim is a prelude to a bear market and/or recession, while that has been true in the US something like 7 of 7 times, it hasn't had any real correlation in Japan, in either case, not good for the market.
As of Sunday night (last night) it felt like a replay of last week (Friday and Sunday leading to some sharp, fast downside in the averages)...
Futures Opening Indications for the New Week which was calling for ES/SPX futures weakness, NQ/NASDAQ futures weakness, TF/Russell 2000 weakness, USD/JPY weakness, $USDX weakness and specifically, gold strength... with these charts in specific...(*post continues AFTER italics below)
"As of tonight as Index futures open trade for the new week, many, actually all are reflecting the same negative tone from Friday, especially toward the close and just after.


Of course this is just the open of futures trading, they are 1 min divergences and we have a long night ahead of us, but this is the opening indication for Index futures.

In addition, while the Yen is in line thus far tonight...

I did notice one other asset showing an interesting divergence, gold futures...

So as today ended, the SPX -.73%, RUT -1.29%, Dow -.59%, NDX100 -.77% and Transports which we have been all over recently as a short entry, -1.36% despite lower oil prices.
Opening Indications posted this morning already showed us USD/JPY weakness, the USDX had lost ground while the Yen gained ground-part of our macro themes for each currency. Index futures also lost ground pre-cash open overnight.
By the close...
USD/JPY lost even more ground...


And the Yen (/6J) gained additional ground (pressuring USD/JPY lower) , but again like $USD, put in a negative divegrence near the late afternoon, again, part of the bounce I had been talking about? In any case, it's not anything Im concerned about, it's normal behavior, but the macro trends are in trouble for the broader market.
USD/JPY was off with the normal ES/SPX futures correlation early on, but after the European close, they were stuck like glue.


Sorry, my ES line (purple) is a bit broken around the afternoon, but you can see the correlation pull together right after Europe closed.
And Gold futures which we had seen with a positive divegrence last night....GLD up +1.18% on the day and YG/Gold futures...

Sunday night futures open as posted last night with a positive divegrence, and in line the rest of the day!
I have a feeling though that the gains aren't going to hold or that we may remain range bound so for now, I'll keep the GLD short open...

Numerous gold futures timeframes are negative or in line at best including this 15 min, so beyond the short term 1 min from last night and today, I'm not sold on further gains right now.
As for oil, I've been asked about it quite often the last several days. There's not great multiple timeframe confirmation for a bounce or what I suspect may be a short squeeze first and we are no where near a tradable and trustable bottom area, however I'm not hot on oil short either right now because of the probability of a short squeeze at some point, even though I feel like trying to catch one would be dumb luck until/unless we get more consistent divergences suggesting such a move which we may still. However on playing oil short, we do have what looks to be a heavy volume exhaustion gap from 11/28. Just like capitulation events, it's not uncommon for an exhaustion gap to see several more days of lower prices, much like when we get a Trend Channel stop out and price gets volatile and choppy-although the easy money of the trend is over, there can be some additional gains, it's just usually not worth the risk trying to get them. So as for a long on a short squeeze, until/unless we get more consistent signals I feel the edge is no better than gambling and picking the day of a short squeeze (again unless we get more consistent divergences) is essentially dumb luck and as for oil short, with that exhaustion gap on volume in place, I don't like that trade either, it's just not high probability/low risk at this point. I'd rather look for solid signals or a real, tradable bottom that can support a real move rather than just random, extreme volatility.
I'm not convinced of a bounce just yet and even if I was, I'd call it a speculative trade, not in line with the stronger probabilities, but perhaps worth a trade if things come together, but right now, very much along the lines of what I posted this afternoon in the major averages...

Using NQ/NASDAQ 100 futures as an example, they have the clear negative we were seeing last night carrying them lower today as you can see during cash hours and they have a current negative right now, but that would be in line with a possible "W" bottom just as mentioned for the major averages, so the negative divegrence suggesting more downside for the NASDAQ futures "MIGHT", pull in to the area near today's lows and form a "W" bottom (if so there would likely be a stop run/head fake move just below today's intraday lows), if we saw accumulation at a second "W" bottom and a stop run that is accumulated as well, then that may be worth a short term speculative trade, the charts right now suggest that's a possibility, not yet a probability until we see if there's accumulation near today's intraday lows.
However don't be fooled, this is normal behavior, it doesn't change the macro trends and it would be a speculative bounce at best.
The 5 min charts aren't telling us much more yet than what I just mentioned above as far as short term possible bounces and whether they are worth the risk of trading...

PATIENCE PAYS! However, I doubt very much I'd change any core short positions for such a bounce, I'd much rather have trades aligned with highest probabilities and treat a bounce as a speculative trade.


While the 7 min TF/Russell 2000 futures continues to lead negative, it was the leader last week and as such may have worse relative performance this week, while the blue chips would be likely to have better relative performance.
This is what I mean by the highest probabilities, the 30 and 60 min charts mentioned last night and this morning reflect the highest probabilities as they do with the averages as well...

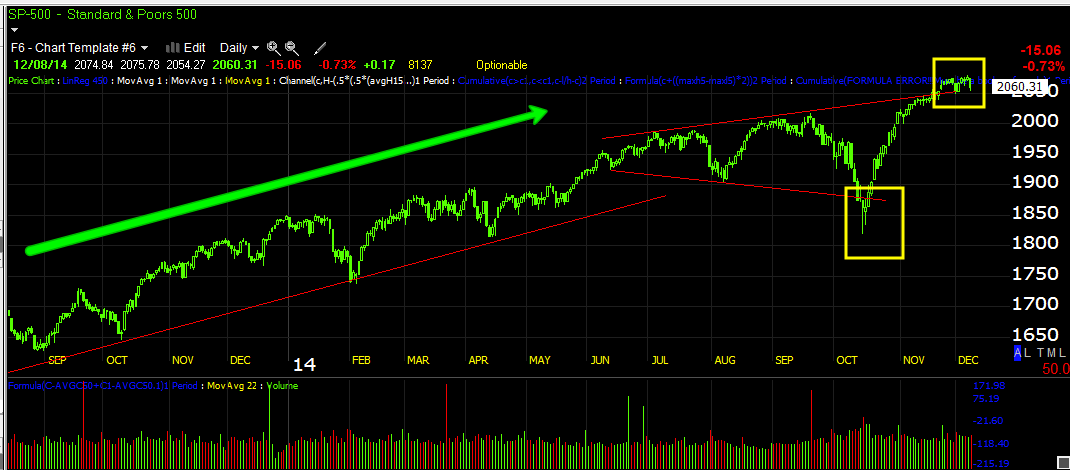
That's not even including the Broadening top and head fake move in SPX...


The daily chart and divergences at the end of July cycle down to the August lows and base with the August cycle / rally to the September head fake highs and divegrence leading to stage 4 decline and the October lows and stage 1 base with a huge leading negative divegrence now, much bigger than the last two pivot highs.
As for Leading Indicators...

Note on a longer scale the VIX term structure inversion and buy signals at the SPY candles and indicator bars painted white. Also note the SPX/RUT ratio giving positive divergences vs SPY price as well as the negative / non-confirmation signals at the September head fake highs and right now in the October cycle which is in stage 3 top/distribution, the next stage is 4, DECLINE.

On a shorter term basis (I took out the VIX term structure as there are no signals beyond the two above), note the non-confirmation at the yellow trend line and at the white in which our SPX/RUT ratio is calling for a move lower which has clearly begun.

High Yield Corporate Credit, as the saying goes, "Credit leads, stocks follow", although HYG is used as a short term lever to ramp the market ...

You can see where HYG led prices higher and where it failed as we saw negative 3C divergences suggesting HYG was done as a lever and traders of HY credit were no longer willing to take the risk, today is a good reason why.

Intraday HYG led the SPX lower early in the morning as VIX also outperformed.


And an even larger view from HYG in line with the SPX to making a series of lower highs and lower lows vs the SPX doing the opposite, again a glaring red flag.
While we are on High Yield Credit, it has been giving very clear recent negative signals which have been part of our analysis expecting a move lower.


And here making new lows below the Bullard dove comments of mid-October.
As for the Leading Indicator, "Pro sentiment", it has been leading the market lower both locally, on a larger scale and in a huge way and intraday, all negative red flags for the market.


And on a larger basis, note all leading indicators are dislocated at the same area and at levels we have never seen before!
TLT/20+ year bond fund was showing a clear flight to safety of bonds today.

You may recall the strong 3C positive divergences in TLT telling us it was going higher last week.
As mentioned above, the long end of the yield curve dropped 5-7 basis points, leading the market lower.


The huge dislocation on a larger scale, again almost all leading indicators have failed at the same place/same time and to the same incredible degree.
Internals- Today's Dominant Price/Volume Relationship is in all 4 major averages, there's 13 Dow, 53 NDX100, 817 Russell 2000 and 205 SPX-500, the relationship is a short term oversold, CLOSE DOWN/VOLUME UP. This relationship often results in a next day close higher as it is a short term oversold condition.
In addition, of the 9 S&P sectors, 3 closed green led by the defensive Utilities sector at a +.81% gain and lagging with Energy at a loss of -4.05%. This too is a short term oversold condition with only 3 of 9 green.
As for the 238 Morningstar Industry/Sub-Industry groups we track, a VERY pathetic, 35 of 238 closed green, ANOTHER DEEPLY OVERSOLD SHORT TERM SIGNAL. Between the Dominant P/V, the S&P and Morningstar sectors, I'd say we do have a short term oversold condition and have a high chance of a bounce, but I do want to see 3C evidence supporting that before considering any trade.
Friday I did mention the VIX move outside the Bollinger Bands intraday and close back inside, not the true buy signal I was hoping to see, but close enough obviously for today, however despite the pinching Bollinger Bands indicating we are about to see a highly directional move in VIX and our custom buy/sell indicator on a buy signal, VIX has not yet broken out of the BB channel, so we're not even in to any thing serious on the downside yet as for the market broadly speaking.

Note my custom buy/sell DeMark based indicator with a perfect sell signal last tie at VIX pivot highs and recent buy signal at VIX lows and of course Friday's intraday tail outside the Bollinger bands and close within, it is still siting inside the pinch, waiting for a highly directional move to the upside.
Today also gave us the 4th Hindenburg Omen in 5 days, a clear cluster (some say 5) which hasn't been seen since the September highs. Whether 4 or 5, the disparity between new highs and lows along with the McClellan Oscillator in a clear negative divegrence, the cluster is not good news for the market.
The MCO is clearly in Hindenburg territory, below zero as well as being divergent vs the SPX.

McClellan Oscillator vs SPX...
While not used (by me) as Hindenburg confirmation, the vertical move upwards in new hi/lo for NYSE stocks is part of what causes the Hindenburg Omen.

High Low Logic Index vs the SPX, not the vertical parabolic move.
The Cumulative Volume Index has gone severely negative after the recent freeze in breadth indicators (bad in itself as they aren't confirming the market).
As I saw last week with a increasing Rate of Change, the Percentage of ALL NYSE Stocks ABVOVE their 200-Day Moving Average has rolled over just as I had predicted, just because I'm use to seeing differences in Rates of Change, I demonstrated using a 5-bar moving average on the indicator...

Indicator in green, 5-day ma in yellow turning down and SPX in red. Not only is there a large divegrence with the indicator making lower lows/highs, but right now only about 48% of all NYSE stocks are above their 200-day moving average, meaning more than half are essentially already in a bear market and it's turning even lower!!!!
The Percentage of NYSE stocks above their 40-day moving average is near the 50% mark and turning lower as well as being long term divergent vs the SPX, breadth is a mess. The stock market may be near all time highs, but the market of stocks is in a virtual bear market, this is due to the magic of weighting of the indices and buying the weighted stocks. As recently mentioned, VISA carried 9.42% of the Dow's weighting while General Electric carries on 0.93%, so if you want to goose the market, which stock do you buy?
Just about every Breadth Indicator is massively divegrence and nearly all are getting ready to roll over to new lows.
To make matters worse, the Black Swan Index, SKEW is printing at nearly 138, meaning someone is buying a lot of deep out of the money puts which are only worth something if the market falls hard and hits those deep out of the money strikes so apparently someone knows something the market is not yet reflecting in the averages alone , although every where else, or there's MASSIVE hedging for the same reason.
That will do it for tonight, I'll check futures before turning in and update if anything pops up, otherwise we are in a bad spot, but may have a short term oversold bounce on a very short term scale, but as always, the market will do its best to make the largest group p of people wrong at any one time, don't get thrown off track, you know where probabilities lay, they are SCREAMING!


No comments:
Post a Comment