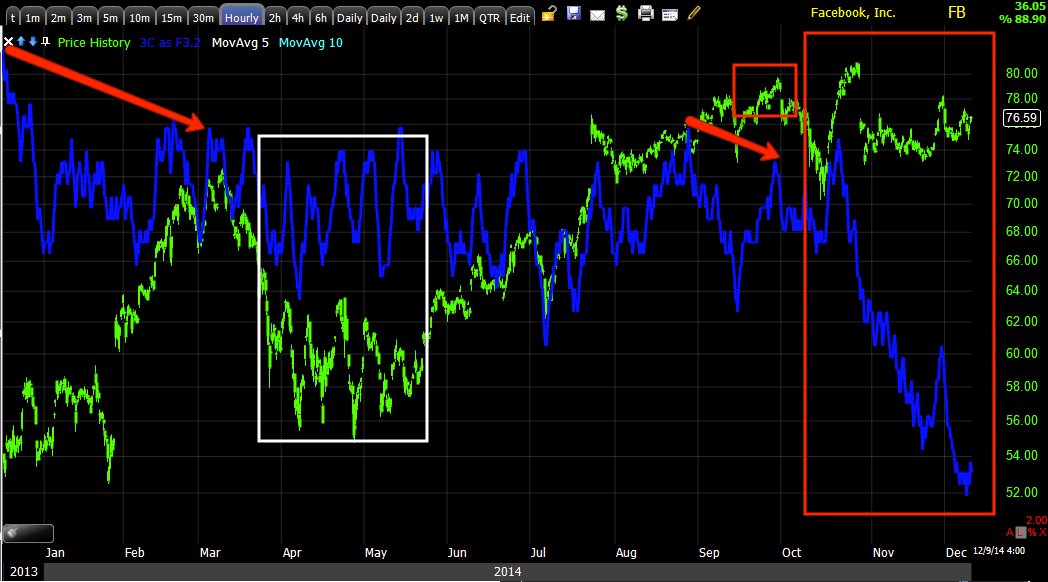
I'm going to put out a more comprehensive FB update as it is one of our long term core short positions. I expect some near term volatility., but if you are a longer term position trader, FB is looking very interesting, I'm glad it's one of our core shorts and if I could, I'd absolutely be adding to it in the near future.
For a quick look, these are the macro trends or the strongest underlying flow of funds and they are moving out of FB as the F_E_D's Yellen herself slammed social media stocks along with biotechs, although that would be the very last reason I'd consider a FB short.
After FB's initial IPO which was a disaster and FB quickly became one of the most hated stocks, we were the first to go long FB at the very lows around late August 2012 and made a nice 30-300% for our trouble (some of you played long calls)
Here are some of the better reasons to look at the core short...
This is a long term multi-day (2) 3C chart showing distribution and some accumulation at several areas, but by far the recent flat-ish top looking trend has seen some of the deepest 3C distribution FB has ever seen, in addition to the point that it clearly looks like a stage 3 top.
The VERY strong, but more detailed 1-day chart shows FB distribution in to early 2014 highs and the pullback, but FB never recovered or saw the kind of accumulation needed to support additional gains and rather it looks to have turned to a stage 3 top with 3C again at all time leading negative lows, less money flow than when FB was $25!
This 60 min chart of FB grabbed my attention, but there's more analysis than just this, however if you are not one to be caught up in the details and are looking at the larger trend and can trade that trend, FB is looking very ripe for a short sale, add to position or even a partial position that is added to.
Whatever the case may be, I suspect a year from now you'd be very happy having entered FB short in the area, however I will cover it in more detail as stage 3 tops often have a lot of volatility and it can be useful for entries.
As for my custom Trend Channel, the first custom indicator I created based on the Turtle Traders and their concepts and the first indicator I won an award for... you can see to the far left how the Trend Channel self-adjusts to a stocks's most recent volatility, keeping as much of the trend as possible which was almost all of 2013 and a good portion of 2014 after the negative divergence and pullback around the Q1 highs.
The current stop out for this trend is at $108 on a closing basis, below that and FB is very likely to start a new trend, just a downtrend which is in line with out core short position and longer term 3C charts.
More to come on FB...
Is interest rates about to start going up?
-
Yes, I know - it does not make any sense - FED is about to cut
rates...but....real world interest rates are not always what FED wants it
to be.
6 years ago


No comments:
Post a Comment