Before the close I posted
Holding GLD Short which is down -1.72%, it was up quite a bit more putting the position at a bit more of a loss, but what I consider to be objective evidence, the charts, told me the probabilities were best (for now) holding GLD short.
While I know that GDX (Gold miners) are not exactly the same as GLD (gold), they do share a tight correlation and about a decade or so ago, Gold miners use to actually lead gold, you might say in a way they still do. Remember this is short term trade perspective I'm addressing because I actually think there's an impressive year long GDX base that could lead to a secular bull market in the PMs and miners.
GLD (green) vs GDX (red)
On a daily chart you can see miners (red) and GLD (green) share a pretty tight correlation.
Some might even make the argument that like in days of old, gold miners still lead gold. For example this 60 min chart of the two show gold a bit more enthusiastic than miners and miners turned out to be right in retaining a more "guarded" position.
On a 15 min chart you can see a pivot high in which gold miners (GDX) were once again less enthusiastic than GLD, failing to make a new higher high before both rolled over and once again recently in which gold went for what looked like a breakout move, but miners refused to confirm ending the move for GLD.
Near term on a 5 min chart we get a closer look at GLD's enthusiasm for an apparent breakout attempt and GDX's more sanguine approach of not making a higher high, thus for now, a failed breakout attempt in GLD.
So given all of the above and my post,
Holding GLD Short , what might we make of the last 2 minutes of trade today in GDX (red)?
Here's GDX intraday on a 1 minute chart, that's quite a decline during the last 2 minutes of the day.
As for the 3C charts, perhaps there's some explanation here as we look at GDX. Since a small positive divegrence on a 60 min chart, GDX's move has run in to a 3C negative divegrence (red).
In similar fashion the 30 min GDX chart also ran in to a similar negative 3C divegrence just before getting volatile and today's closing 2 minutes.
Even the 10 min chart shows a negative divergence followed by a gap lower and a leading negative divegrence lower in 3C.
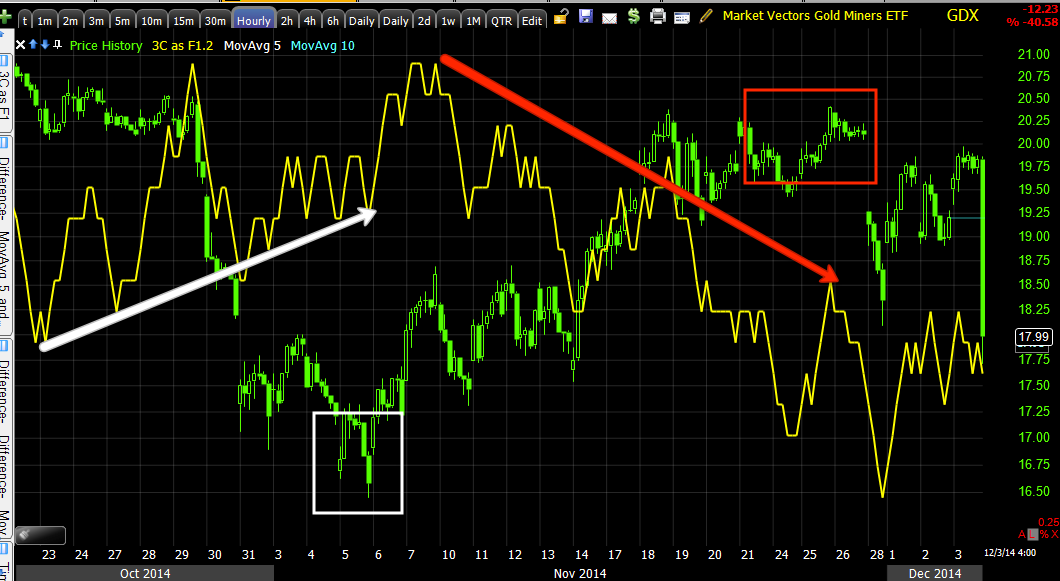
Of particular interest, it seems "someone " knew what was going to happen at the close as the 5 min 3C chart is in a leading negative divegrence the ENTIRE day!
And the more detailed 1 min GDX chart is also in a leading negative divegrence the entire day, IT SURE LOOKS LIKE SOMEONE KNEW SOMETHING ODD WAS COMING AT THE END OF DAY.


No comments:
Post a Comment