From that post, a quick concept that is useful in any asset and any timeframe relating specifically to Monday morning's action...
*In the context of an IWM 2 min chart*
"And the 2 min IWM is starting to build it's intraday positive, note all of these occurred AFTER the volume short term capitulation, so this is a macro/micro concept that can be used on any timeframe, it's especially effective on longer timeframes with bullish reversal (or bearish reversal) candles, such as the 60 min chart I showed earlier this morning."
As for the averages or at least the ETFs, there's some interesting behavior as large volume is not only a sign of a short term selling climax, but in the right conditions can be indicative of a churning/distribution top event. After Monday's selling climax we expected a bounce and at least a gap fill to follow...
*This post probably has a lot more charts than necessary, but I think it's essential for you to be able to identify when the levers of market manipulation are being used, when they are failing and what the message of the market is when the market can't get off a simple bounce/gap fill without the help of outside manipulation. Some may want to come back to the post later and for those who do, the bottom line is USD/JPY has already been shown to be set up for failure. HYG is seeing distribution, but it's not at the point yet in which I'd call it "OVER", although as a leading indicator we may gain more information. TLT/Bonds are interesting and maybe that TLt post will be able to be put to paper soon, it seems there's a reversal getting ready to take place there as well and VIX futures/VXX and VIX are also improving at a rapid clip. Some of the larger picture charts have additional information relating to 3C targets and more.
The averages and their selling Climax Monday morning...


Since, Q's have done VERY LITTLE.

VXX-Short term VIX futures which are knocked down to push the averages up as well as activate the SPY Arbitrage market manipulation lever.
2 min VXX shows the previous positive leading to a move higher, but also the 3C concept of where a divegrence is first seen. If you were to go long VXX where this divegrence was first seen, you can almost always count on a move that easily hits the target and often surpasses it by 100% or more.The current leading positive divegrence now on the pullback is even stronger than the last positive.


VXX 5 min showing a head fake move which we often see just beofre a reversal (up or down), in this case a failed breakout, other times they are stop runs.
Again we have a current leading positive divgerence.
I use multiple timeframe and asset confirmation, so here's the 2x leveraged VXX long, UVXY 5 min chart...

Additionally the inverse of VXX, XIV which trades WITH the market.


Even in futures, VIX futures are going positive.


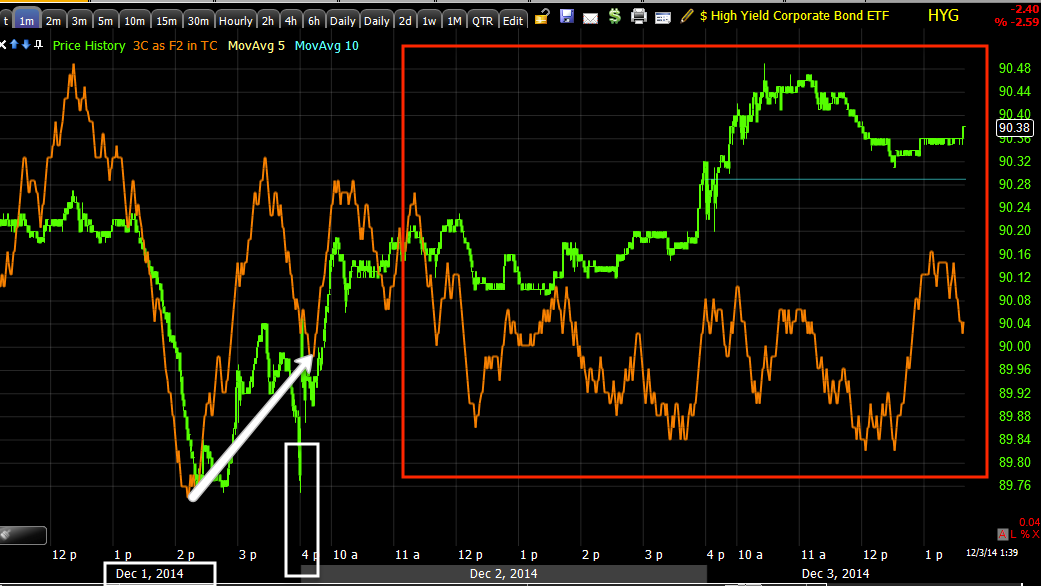
As for HYG, the lever that is used to move the market by moving up, fooling algos in to thinking smart money (whom trades HY Credit as a risk asset) is in the trade...


finally since we already have seen USd/JPY, TLT and 30 year Treasury futures. I was wondering about the longer term TLT, whether there was to be a convergence trade short bonds and SPX until yields and SPX met, or perhaps oil producing countries selling T's to sell dollars to support their collapsing currencies, I'm still not sure, but the TLT charts are looking a lot more close to being resolved toward a positive move up or Flight to Safety and Futures are agreeing.


30 year Treasury Futures agree...


In essence, the levers are doing what they should, they are in their reversal process which will end support for the market making timing much closer.


No comments:
Post a Comment