This post is meant to be taken with the other market updates, posts such as the earlier,
Early Indications and
Looks like USD/JPY Lever Will Give Out as these were the assets predicted to help the market (
which is telling in itself as the market needs the levers and can't get off a simple oversold bounce without them) with a bounce, thus their failure tells us where the market is likely to fail on a bounce and where we have our best entries and lowest risk.
Again, this early in the day (considering most serious trade is in the late afternoon) and I don't want to prematurely say the signals coming through on early charts
(where all new divergences start, even the fade of a bounce) are a signal that this bounce is dying already, but I do have to make you aware of what's going on so when I update later you can see where we've come from and have a better idea of where we are and where we are going.
I'm hesitant to add TLT to this post just because of the possible convergence trade, but for now I'll include some of the early intraday signals until I can get a proper TLT update out, which I'm actually waiting on to see how a few charts pan out which will tell me a lot more as to whether there's a convergence (short TLT/Short SPX) trade in play..
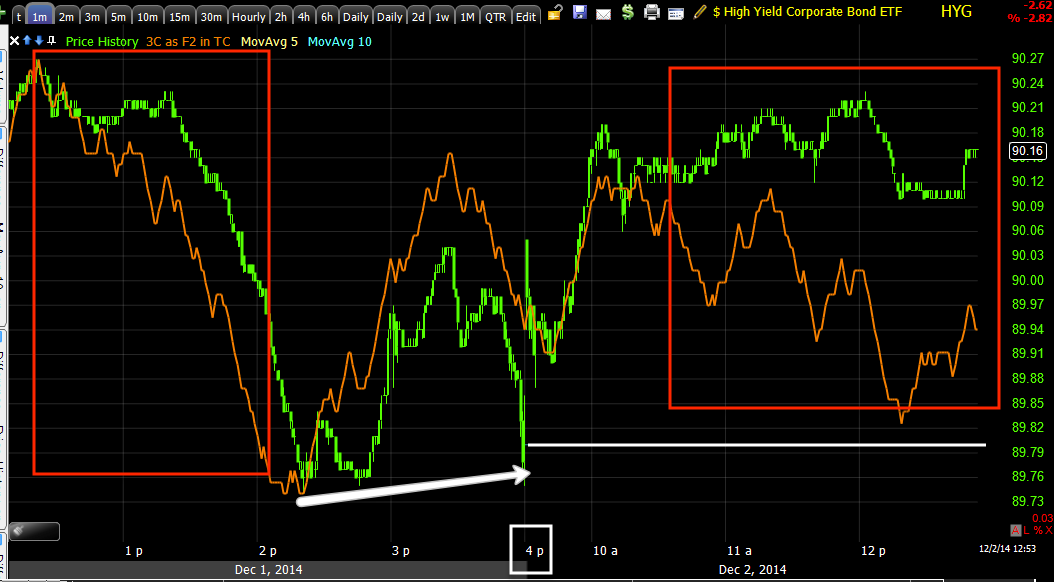
First HYG as this is one of the most popular levers. I can't stress enough that the most important chart for HYG is this one...
No 3C HYG chart below holds a candle to the implication of this chart's leading indication which I can't stress enough how ugly this is for the market overall, it's spectacular and as far as I've seen, without precedent.
I'm going to add a few "Big Picture" charts so you have some context, they provide the roof or floor for any shorter term moves based on shorter term charts.
First HYG...
HYG 2 hour trend is quite clear, divegrences at every high with a new leading negative low. The price trend itself is clearly bearish even without 3C, but this shows the extent to which HY Credit has seen outflows and is damaged as a leading indicator for stocks.
HYG 1 min shows the positive divergence
LEVER for today's bounce which was at the close yesterday and this morning.
It is already seeing a lack of confirmation and negative intraday divegrence.
The 2 min chart showing the same features (the support positive divegrence for the bounce/lever today) and a negative migrating to the next longest timeframe.
The 5 min shows the lows that were accumulated on the 19th when I wrote that HYG was causing me some concern with that positive divegrence, the
Black Friday (week) sentiment support to make sure the market didn't come down and make consumer sentiment worse than it was in front of Black Friday.
This is the 5 min HYG chart showing the divegrences for it to move green today, activate the SPY arbitrage and act as a lever of market support. I'd say when this chart starts seeing the same negatives on the 1, 2 min chart, we'll have seen the end of this bounce and will want to move quickly to load up on short positions and close out any market correlated longs that some of you (thanks for the emails) entered yesterday- I was hoping that someone took advantage of the information, although I urge a lot of caution and tight risk management.
VXX-Short term VIX futures, the 2nd of 3 assets in SPY Arbitrage which needed to move down today to support the market as was posted numerous times yesterday and pre-market this morning.
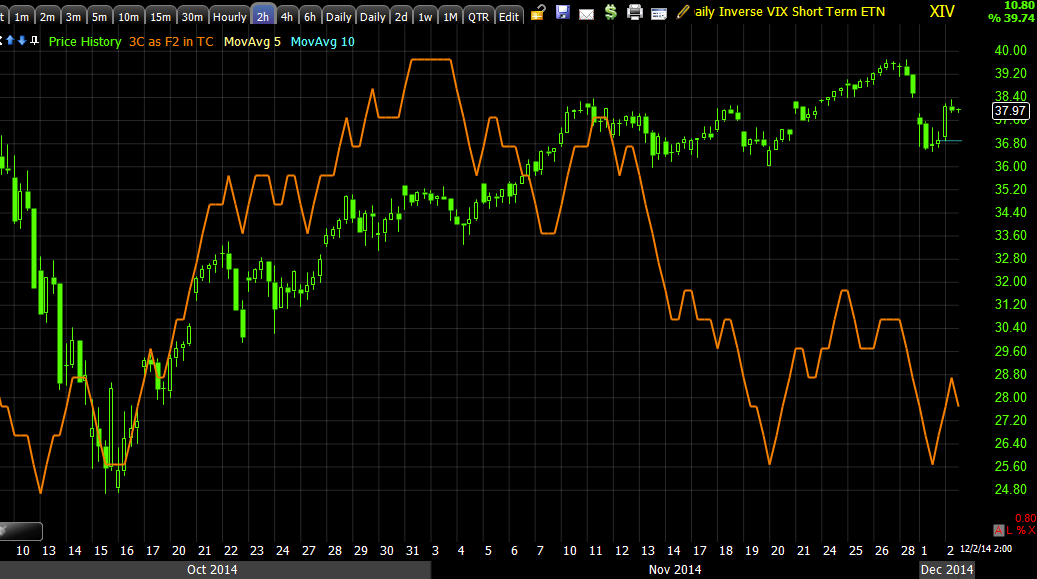
This 2 hour chart should give you a feel for the big picture. Just for multiple asset confirmation, XIV is the inverse ETF of VXX, it trades opposite VXX and with the market so looking at the same timeframe in XIV...
We have confirmation via a massive 2 hour leading negative divegrence. Someone has been very busy accumulating protection/VIX.
In the spirit of multiple timeframe analysis/confirmation, this is VXX 60 min leading positive after the last relative negative at the October lows (VIX highs).
And XIV on the same timeframe confirming with a leading negative divgerence.
VXX has seen some recent accumulation last week, interestingly right before Sunday night and Monday's sharp crack lower in the market.
XIV confirms the same as it was sold in to heavily last week/Friday before gapping lower yesterday.
VXX's 5 min chart's main feature is a large positive reflecting the 15 min charts above at the same area as well, the minor feature is a small negative to the right which is the ramp/lever to activate SPY Arbitrage which needs HYG higher as it is today and TLT and VXX lower as they are today.
Intraday VXX is showing improvement and positive divergences/accumulation as the gap from yesterday is filled.
XIV 1 min confirms as it is sold in to higher prices as it's gap down yesterday is filled.
VXX 2 min seeing migration and a stronger divegrence building suggesting
that this lever is about to or is starting to break as well like USD/JPY.
TLT (20+ year treasury fund), a proxy for the long end bonds like the 30 year.
While my larger analysis on TLT will have to wait, the gap down is market support via the SPY Arb lever and all 3 of these assets were predicted yesterday to support the market bounce today.
Again however we are seeing intraday improvement on the 2 min above.
As well as the 3 min meaning migration or a stronger divegrence forming.
And even on the 5 min.
We'll check these again, I won't have to post so many charts if any as you now know where they stand and anything from here on out tells us a lot more about where we are in the bounce process.


No comments:
Post a Comment