This is perhaps some of the best data so far. Yesterday I would have never called for a bounce based on the averages alone, most of the data showing a bounce for today (at least before the close and a look at internals) was the flame out or 1-day oversold condition and Index futures.
For a better idea of how long Index futures divergences last (as they are different than the 3C charts on the averages), check out Sunday Night's post in which we could clearly see the trouble ahead in the market and not only near term as in Monday morning, but larger scale which is upon us now, so this post is worth revisiting any way... Sunday Night Index Futures
ES 1 min
The 1 min chart has been in line all day as we have seen with numerous other assets suggesting we are not done with the bounce yet,
however recent negative action has picked up, even worse than this as it is moving pretty fast.
This is what the ES 5 min chart looked like yesterday and how it was easy to forecast a bounce as there was a clear 5 min positive divegrence. Now the same ES 5 min chart looks like this...
The same positive is there and there's still fuel in the tank,
but there's a VERY clear distribution / negative divegrence in to today's move higher specifically (look at the red arrow/3C and price).
NQ/NASDAQ 100 futures 1 min
These are clearly in line and probably about time as the NDX has been the laggard all day and still is. I wouldn't expect to see any negatives yet being it hasn't made that much of a move, but they just started setting in and if my gut feeling is accurate, that smart money really doesn't need to sell/short in to price strength because their positions are already set just like mine and many of yours, then it's not surprising to see a more mellow divegrence softly turning.
The 5 min NQ chart is one of the reasons I said I thought the QQQ would be the laggard today, NO POSITIVE DIVEGRENCE!
However there is a clear negative divegrence setting in on this stronger timeframe.
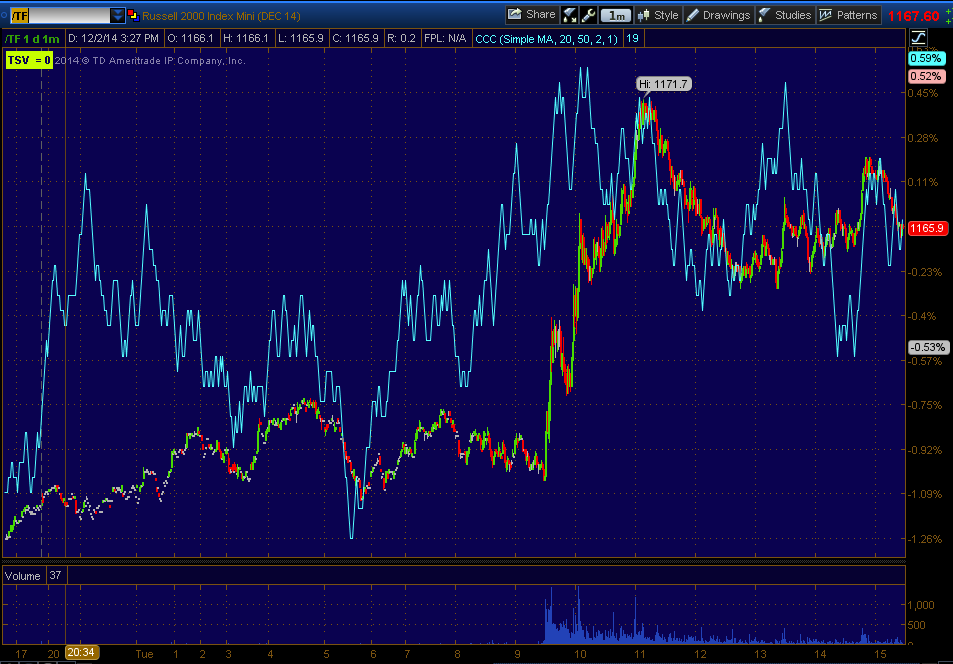
TF intraday which is about in line,
but also trending sideways looks about pegged for the day unless there's a VIX slam.
This is what TF looked like yesterday making a bounce call pretty easy and a high probability, but now...
Again, the same distribution/negative as ES in the same area as well as the same area as NQ even though it has barely moved in relative terms.
I'd say we are not done with the bounce, but we are at the start of the end of the bounce.


No comments:
Post a Comment