Ironically, the "W" based pattern with a head fake move is EXACTLY what we have today and the area yesterday in which a positive divegrence started to form and then failed, as it got no further than 1 min charts, is the same area price is in today. My best guess is that a bounce was planned, it was run over and fell out of their control, thus yesterday was real and intense selling, but they haven't abandoned their plans.
I'm going to put out a futures update as well as futures have been giving some of the best signals, but things move fast so I can't put too much in one update as the charts will change by the time I get it out.
I still feel the same as yesterday, this is the market doing what it does best and making the most number of people wrong at once. Technical traders who followed the market and shorted it after seeing weakness yesterday afternoon are shaken out this morning. Those buying as the market runs upp this morning will be shaken out on the next leg down as this is a short term move. The market never makes it easy or plain to see for most, but if you stick with the highest probabilities, ignore the games or use them to your advantage, you should avoid being shaken out, you should end up with great positions and with patience, you should end up with very nice gains, but getting caught up in every shake and shimmy of the market up or down in volatile moves will just leave you stopped out of a lot of positions, this is what Wall St. does best and the only pattern to this kind of price volatility is to "Make the most number of traders wrong as often as possible" whether it be the "Buy the Dip" crowd or the "Cautious Shorts". I find sticking with the trend of highest probabilities is your best course of action and understanding what the market is actually doing, it's not a response to oil prices as CNBC may try to make you think; the market is not that simple and no even close to that honest.
Hopefully these charts will make things more clear.
SPY 1 min which has a deeper negative divergence than this chart shows as it is a few minutes older and price should pullback a bit,
but note that price is right in the range yesterday where the positive divegrence tried to set up shop. Since it didn't get past a 1 min chart in SPY, it wasn't very strong at the point it was run over by real selling, thus last night's futures that showed signs that the $USD would be up, the Yen down, the USD/JPY up were all signs that we'd be headed back to this area, I even said I thought it would start overnight and it had to carry in to today because of some of the short term divergences in the averages.
Also,
on Tuesday I talked a LOT about a Double Bottom or "W" bottom and how they "use" to see the second bottom fall short of the first bottom's lows, but now since that is such a well known technical price pattern, Wall St. always makes a stop run below the first low creating a "W" pattern that has a lower second low just as we see above where the second divergence or completion of the "W" is.
On a price chart of the SPY alone, this is the EXACT concept we were talking about and warning, to look out for.
Note the "W" pattern, but the shakeout or lower second low forming the "W" bottom. Whether this was intentional or not is hard to know because this was a concept we discussed in several posts well before yesterday's break. The other possibility is that it's random after yesterday's break or it was just opportunity to create that double bottom as the market faded yesterday seemingly breaking the divergence they were trying to build and they simply created a larger "W" bottom by running prices a little lower than they had naturally moved yesterday creating the shakeout below 12/9's lows, which there seems to be some evidence of in late day trade yesterday. Either way, it's not that important, but the chart above is a
picture perfect example of the concept.
SPY 5 min is the chart I still want to see break down. You can see Friday's weakness leading to Monday's. You can also see a positive divergence at the "W" base area, but it is a weaker relative divegrence rather than a stronger leading divergence. Another sign this is a short term move (note I did not say a "weak" move), the point of the price volatility is to be believable and shake traders out or get them to enter positions and to do that, the moves must be believable and inspire either fear or greed to get traders to take action., there's no other reason for the moves, unless you believe CNBC's nonsense, like the market being down earlier in the week because of oil being down when oil was actually up.
CNBC's job is to provide viewers with something that feels like certainty, something that helps them comprehend the market and feel like they understand it and thus have some measure of control, but you simply can't get that kind of understanding of the market in a 30 or 60 minute show that is there to sell commercials, that's what CNBC exists to do and the easiest way to do that and gain viewers is to make them feel like they understand the market and thus have some measure of control.
This is a serious market break, not only has the Broadening top been broken, but this is the first time since the October lows that price is making a series of lower highs and lower lows. Follow the yellow hash marks to see the lower highs and lower lows, a downtrend.
The QQQ 1 min with a very late day positive divegrence. When I said above,
"The other possibility is that it's random after yesterday's break or it was just opportunity to create that double bottom as the market faded yesterday seemingly breaking the divergence they were trying to build and they simply created a larger "W" bottom by running prices a little lower than they had naturally moved yesterday creating the shakeout below 12/9's lows, which there seems to be some evidence of in late day trade yesterday. "
This QQQ divergence at the end of the day at those lower price lows is the evidence I was talking about. The stops run in SPY below Tuesday's lows were accumulated late in the day, although small.
The 1 min negative on this chart has grown since I captured it.
However on a 15 min chart of the Q's where the stronger underlying price trade is shown, there's clear damage from yesterday as the 3C divergence hit a new leading negative low .
Note the "W" pattern in the Q's as well.
The IWN shows the same late day divegrence which is clear by the close or around 3:50 p.m. and the 1 min chart is in line with price which is what I mentioned in the last "Quick Update".
Russell 2000 futures (/TF) do show an intraday negative divegrence.
IWM 2 min chart showing last week's weakness going in to this week in which the head fake move in the red box to the far left performed perfectly,
we see these head fake moves, this one a false or failed breakout which as usual, are the best timing signal as the reversal almost always directly proceeds the head fake move which is seen in about 80% of all reversals up or down.
You can see the clear positive on the open Tuesday and a negative in to the highs late Tuesday as well as the small positive divegrence that didn't get very far yesterday before being run over. Had this divegrence been bigger and reached longer timeframes it might have stood, but with such a small divegrence, as market volatility (downside) picks up, these weak divergences are more commonly run over, I wouldn't say a majority of the time, just more often.
The 2 min chart is not in line with IWM's price today and thus there's some weakness in today'
s parabolic early move off the open which used levers, specifically USD/JPY as you'll see.
The IWM 3 min chart also failed to confirm this morning to the far right. You can see a stronger 3 min negative at Tuesday's highs and the positive being built on the 1 and 2 minute charts yesterday never reached the 3 min chart, making it a lot easier to run over as the dominant divegrence is the leading negative from Tuesday's late day highs.
HYG's longer 3C
1 min trend is still in line with lower prices, however as guessed last night in assuming levers would be used to push prices higher during the cash session today, HYG was used on an intraday basis.
Note the 1 min positive divergence and small "W" bottom with a move up since then, supporting the broad market.
The much stronger HYG 3C 2 hour trend is very much in line with lower prices.
TLT which I suspected would be used in last night's post as a lever as well, sending yields higher and helping the market, was also showing a small negative in to the close yesterday. I wouldn't consider this a significant divegrence at all, until the late night futures started to make clear other divergences and the 30 year treasury futures went negative.
However TLT's 5 min chart is still in line with the uptrend,
more evidence this move is short term and...
The stronger TLT 60 min trend is still is a very strong leading positive divegrence, again suggesting the market's bigger picture remains down.
This is USD/JPY (candlesticks) vs ES (purple) which was helpful in moving futures up overnight as predicted in last night's post, but also as predicted in last night's post, this move had to last in to the cash market open as divergences there need to be dealt with so note the move up in both right at the 9:30 cash open, this is where USD/JPY had the tightest correlation with SPX futures.
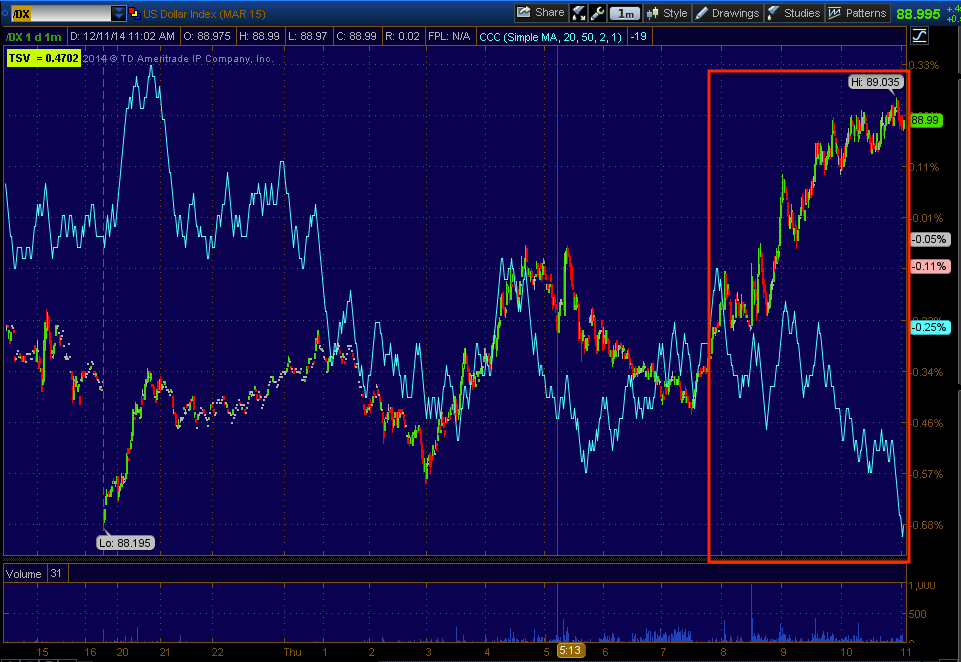
This $USDX 1 min negative taken around the time of the "Quick Market Update" warning of intraday negatives likely to pull the market back, which has now sent most of the averages lateral/sideways rather than continuing up, is one of the reasons I suspected that as this would slow down the USD/JPY or even pull it back , remember the USD/JPY has been an effective lever in lifting the market overnight and this morning.
Other than the positive divegrence seen last night in $USDX which helped me figure out what I thought was most likely in last night's post,
Quick Futures Update, the chart is no better than in line, again signs of a short term move.
The Yen 1 min is in line with it's trend lower which was higher yesterday until last night's post,
Quick Futures Update which I could see Yen negative divergences which played out in the overnight session and continue to.
The longer term 5 min Yen chart though retains its positive divegrence. Another sign this is to be a short term move, likely determined by the market averages (cash market divergences).
I want to take another look at some of the longer Futures charts to get a better idea of how long I think this may last or where it may move to before I start looking at potential short sale assets in to today's price strength.


No comments:
Post a Comment