By far my favorite trades are those that come to us on our terms, they give better entries, they reduce risk and they allow us the chance to let the theory of the set up prove itself, AAPL happens to be in one of those situations "IF" one small 5 min divegrence isn't run over, you might remember, but AAPL has been my nemesis in this lesson as I had been calling for a major top in AAPL for months as it was making all time new highs and AAPL longs were more stubborn than gold bugs in 2010.
AAPL did top, I did have a well positioned short and then followed a small 5 min positive divegrence closing the short in anticipation of re-opening it at better levels, the divegrence was run over as a panic set in on Dan Loeb's Third Point holdings and all out panic ensued with AAPL losing -45% of its value in a mere 8 months.
Still, the trade has to prove itself so nothing wagered, nothing lost.
Here's the set up...
This is the daily MoneyStream chart, a Don Worden indicator so I trust it, it's just not as sensitive as 3C or detailed, but when it has a trend like this of distribution, I take it seriously.
Please remember I no longer (nor does the market) consider AAPL a growth or momo stock, it still has its NDX weight, but as I have shown so many times, the death knell of MSFT which was an even stronger growth/momo stock than AAPL pre-2000 was their declaration of a dividend which made it a large cap mainstay for investors and it tends to stay within a wide, but fairly predictable range, AAPL I believe has just started down that road as well after losing 45% at our top call in a mere 8 months.
The daily 3C chart shows the same distribution in the area, just more detailed.
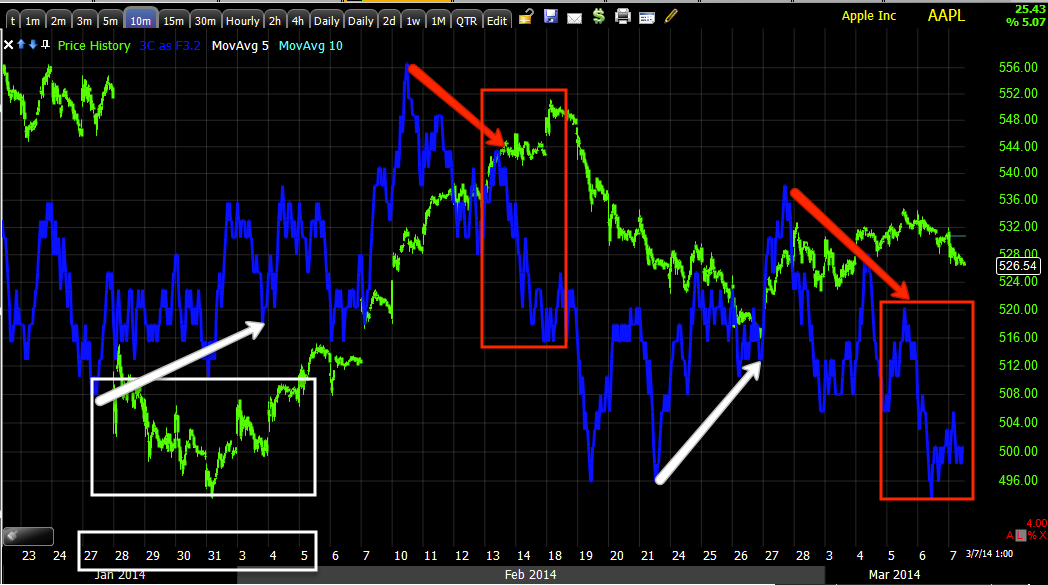
Here the 30 min chart shows equal prices to the left, but a strong leading negative divegrence on the second high leading to a strong sell-off/gap down, that's when AAPL
saw accumulation with the rest of the market from Jan 27th through the first week of February, yet AAPL's relative performance has been lacking.
The 15 min chart shows a more recent positive divegrence in AAPL sending it sending it up about 55 points in to a negative divergence/distribution which AAPL has now just started to move down from.
It is these divergences that hold the probabilities to AAPL's sub-intermediate trend resolution, they obviously are leaning to the downside, but if we can get a short position in place on a bounce to get a better entry and lower risk which could have a stop just above the recent highs (as long as it's not in an obvious area or at a whole number) and see that there's distribution in to the bounce (and I mean bounce in the true sense of the word, not a rally, then we have a pretty decent set up as I feel AAPL's potential downside after all is said and done (that means there will be a few interruptions along the way, but nothing a trend trader can ride out) is likely around $450 first and then $400 making for a decent move of about 125 points.
This is the 10 min chart, also quite clearly negative and in line with everything else we see happening above, it is the 5 min chart that may present our opportunity.
Here we see several divergences that worked perfectly from a leading negative to a leading positive to a negative and a very small 5 min positive, this is why I say "bounce" in the true sense of the word, not rally.
Since it's such a small divegrence and the market undertones are so negative, it is difficult to judge where it might bounce to if the divergence can hold, but I don't see it moving beyond the recent top, however the higher the better for a short entry and risk profile, we'd just need to watch AAPL and set alerts to see when it looks like such a move has ended,
again, IF it can get off the ground with all of those negatives piled up.
I am looking at my X-Over chart (15 min) with a new sell/short signal at the last negative divergence at this top, this chart would suggest a move to the blue 22 bar moving average, although we've already seen one to that area so the next is often a bit higher, maybe the high wick around the $531/$532 area would be a possibility as there's good overhead resistance there,
either way I intend to set multiple price alerts.
One thing that bothers me is there's no RSI positive divegrence, at least not yet so this is still theoretical, but a decent set up for a potential 100+ point move.
The 3 day Trend Channel which has held AAPL's up trend broke or stopped out recently at the red trendline on a closing basis at the red arrow, this means any bounce is HIGHLY unlikely to reverse this downtrend now in effect on a much larger scale and $450-$400 is really not at all out of the question considering, although I suspect there's be some gamesman ship as nothing moves in a straight line, around $450.
If you are interested set some upside price alerts, I'd take AAPL short here if this opportunity weren't presenting itself as every other chart is confirming a turn down in AAPL.


No comments:
Post a Comment