I'd say judging by the overall tone of the market today, last night's Daily Wrap Dominant Price/Volume relationship and the Sector indications, were right on...
"The Dominant Price/Volume Relationship was Close Up/Volume Up which is the most bullish of the 4 relationships, but ironically it also tends to lead to a 1-day overbought condition most often seeing the following day down....
Eight of nine S&P sectors closed green led by Financials at +2.47% with the safe haven Utilities lagging at -.43%.
We also had 227 of 238 Morningstar groups close green, overall not bad at all, but both imply the same thing as the Dominant P/V Relationship, a 1-day overbought condition."
As for the example charts mentioned in the Week Ahead post, here they are (the SPY is a good overall example).
Since 3C charts most often pick up where they left off in the cash market (even over 3-day weekends), I'd say the intraday 1 min negative should see Monday open weak. However, right behind that is the 2 min chart...
This isn't weak and this is why I said I think by noon-time some strength will filter in to the market, but this is really small potatoes.
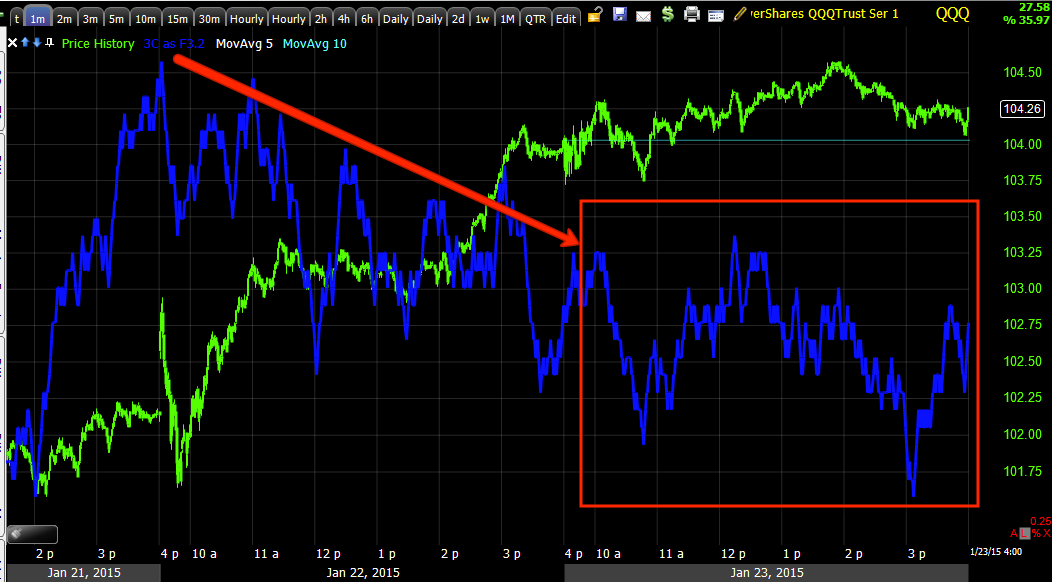
The same thing is apparent with the QQQ 1 min, negative
And while the 2 min is a little negative, it should lead to mid-day or late day strength.
The IWM is the same (2 min).
And while the 3 min is a bit negative, not enough to keep it from pulling it back together, especially given the IWM hasn't hit the minimum targets and for that reason (I believe) has better looking charts relative to the other averages.
Here's where we get in to the more important trend changes. The 3-5 min charts have been where the based formed and about as far out as the divergence (positive ) went...
You can already see damage on the SPY 5 min and just compare it to the last top areas and divergences in the SPY (5 min).
While we are not there yet, we are not far at all.
The same is apparent in the QQQ 5 min, deterioration on the most important chart for this bounce.
The IWM went a bit further out to 10 min, as I said it has better looking relative charts, there's some damage, but it still has a bit more to go to at least hit the minimum targets posted last week.
At the 10 min chart where the next trend is lining up (down), you can see clear and heavier damage, certainly in line with the divergences that sent the SPY lower from each of the previous pivot highs.
The QQQ 10 min needs no commentary.
And the IWM 15 min is again stronger relative to the other averages, the minimum target is the yellow trendline, After that I think we see heavier selling in the IWM and more deterioration along the lines of SPY and QQQ.
SPY 15 min is already or still leading negative, this is the intermediate or sub-intermediate trend vs the current short term trend, we should return to this trend and lower highs/lows.
The equivalent for the IWM is the 30 min chart. Remember the range in the IWM and Crazy Ivan shakeout we were looking for above the range and the fact we expected it to be a head fake/failed breakout, there it is in the yellow box, since then ther has been even more damage done here.
Finally the HYG positive went out to the 5 min chart, you saw the HYG charts today so no need to post them again, but I did want to show how much damage has been done and how quickly. I suspect early next week HYG will be leading to the downside in actual price and at that point, the market shouldn't be far behind.
I may post some additional information after taking a quick look around, but I think this is a pretty fair summary of expectations in to next week, we've had a pretty good bead on this market so far with the bounce and what is now showing up as more aggressive than usual selling.
Have a GREAT weekend!


No comments:
Post a Comment