I'm going to put out one other update, but as usual, because of the fast nature of intraday signals, I can't have charts that are too old.
Last night I documented some negative activity, not enough to make any changes in near term expectations/forecasts such as a market bounce off 14th- 16th small "W" bottom.
My "best guess", is that the ECB leak this morning was a test of how the market would respond to the proposed size of an EU QE program, but there are so many details, different forms, possible legal challenges, possible lack of support, I don't think it's worth speculating on unless we can see something that is specifically pointing to a leak that looks strong enough to be legitimate.
However I do want to continue to document any changes, especially with a leak out there.
The last "Quick Update" about intraday trade didn't include charts because it was rather fast moving. However for the same reason I included such charts last night in the Daily Wrap, I'll include them now, if there's a fast moving market and a sudden and important change, I don't want you to feel like you skipped several chapters in the novel, I want you to be able to understand what has transpired, what has changed and if we get an outlier event/signal, I don't want you to feel like,
"The last I heard we were expecting a bounce and now...".
Not to be confusing, I am still expecting a bounce off the same base area mentioned above, but do want to document changes, if for nothing else, to allow you as much information as I have to make any decisions you may want to make.
The charts of the averages...
SPY 2 min change in character today leading to downside.
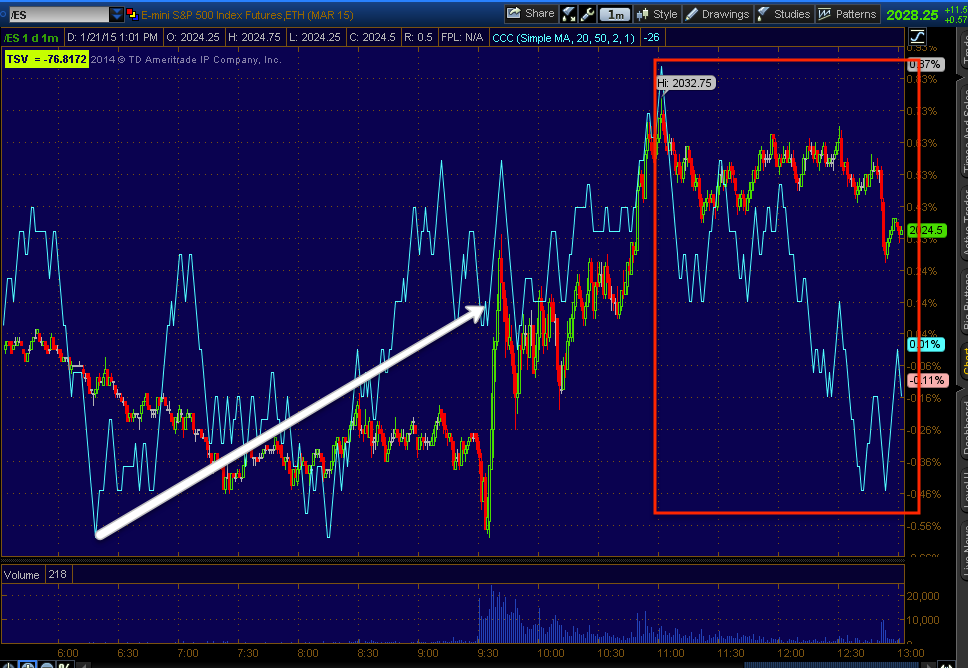
This was more evident in the ES 1 min chart.
The SPY 3 min chart still has a decent positive divergence/bounce base in place, there hasn't been any deterioration that would make me think a bounce is still not the most likely near term course.
Obviously, from market action yesterday and today, it seems pretty plain that this bounce is suppose to line up with the ECB announcement, which has too many "ifs" to even start to speculate about,
I'd just warn not to get complacent in the conventional wisdom.
Interestingly, the 5 min chart has been for the most part, the division between a bounce and weaker charts that in multiple timeframe analysis would represent what comes after a bounce, and that is a negative trend.
So to see deterioration on the 5 min SPY is interesting. While it didn't migrate over from the 3 min chart, it is entirely possible that the 5 min chart caught transactions at certain times that would not necessarily show up on a 3 min chart, at least not in trend form that creates a divergence. This is rare to see, but does happen.
DIA 1 min negative intraday which is very clear.
This migrated over to the 2 min chart. Remember though the base for the bounce is largely on the 3 and 5 min charts. However again, I need to give you a heads up on these changes, especially if I find more in other places that start to build a case for a change in near term expectations.
The QQQ 1 min has a very nasty 1 min divergence, but recall it was the Q's that had the sharpest move higher yesterday.
In other words, to sell in to price strength, you need price strength which the Q's had yesterday, thus seeing a sharper negative divergence here is very much in line with short term bounce expectations and how we get to the next phase represented by the 10 min charts , SO THIS IS ACTUALLY CONFIRMATION OF WHAT WE EXPECTED TO SEE ON A BOUNCE.
The slightly different question, but along the same lines is whether we get a FAIL on the bounce like the last one off the lows of the first week of January (1/6) with the FAIL at 1/8. While it may not seem like it makes a difference in the near term expectations, it does make a difference in how we use them to our advantage and perhaps which assets are best suited to trades.
QQQ 2 min looking really bad as well.
At this point we even have some migration to the QQQ 3 min chart.
The IWM 1 min chart was in line so I didn't include it in the warning and the TF 1 min was as well, but looking at the 2 min chart, there's obviously a negative divergence.
The IWM 3 min (bounce ) positive is still intact.
As for Index futures...
ES 1 min with the pre-market positive and the recent negative.
Yesterday I made note of the 5 min charts going negative as well as the fact that in the past, I'd use these as short term trade signals so a negative ,like this would be a set-up for a short position, or in other words, there had to be at least a 5 min Index future divegrence to enter any trade long or short.
The deterioration here seems to be notable.
The 7 min chart has been the neutral zone, kind of like the difference between the averages' 5 min positives and 10 min negatives, however while ES and TF are still pretty close to in line here, NQ, again the average that moved the most yesterday, is showing the worst divegrence on a 7 min chart which is actually negative, maybe not as solid as 5 min charts, but it is negative. The fact I don't have the same for ES and TF is partly what holds me off from making any short term market expectation changes.
I'll be adding leading indicators as well...


No comments:
Post a Comment