You'll have to excuse me this morning. I'm spending some time looking at everything I can with a fresh pair of eyes, no assumptions and just seeing what's there so I'm actually going through quite a few charts.
The main reason, which I'll show you is the SPY looking better than the QQQ or IWM and looking like a potential "W" base from the January 6th lows until the recent price action.
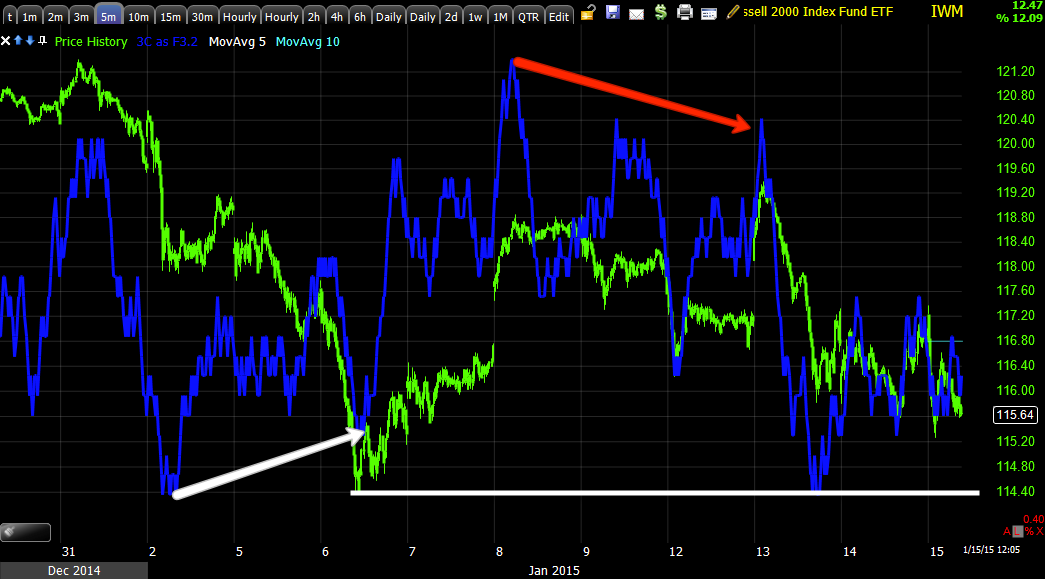
With everything else that's going on, I normally wouldn't look twice at this IWM 5 min chart.

However this SPY 5 min showing more positive tone the last two days has me looking twice. Of course we have expected an oversold bounce since the positive divergence on the 5th and 6th which didn't go very far before showing signs of trouble on the 8th so the move never lived up to its potential.
There's also the SPX:RUT Ratio and VIX Term Structure which is similar to the SPY chart above.
The SPX:RUT Ratio (red) has a slight positive disposition and the VIX Term structure has its second buy area. What I'm trying to determine among other things is whether the first buy area already was spent on the move up to the 8th/9th and the current buy signal is the oversold bounce we have been looking for any way or whether this is a larger pattern like a "W" bottom .
There's also a lot of things that will change in the market because of the SNB's overnight actions, just from a perception point of view and perception is more than enough to move the market. So I'm also looking for anything that has or is changing since yesterday before the SNB action and today after the SNB action that is suggestive of a change in perception.
I have to look at this more carefully to be as reasonably sure as I can be that this isn't something different than current expectations or current expectations as they develop.
So I'm going through breadth charts, currencies which have been turned upside down this morning, Leading Indicators, sectors, averages, etc.
Intraday there's a similar disconnect between SPX futures and NASDAQ/Russell...
ES 1 min intraday is more positive looking than the other Index futures...
NASDAQ Futures intraday have a small relative positive divergence.
Russell 2000 Index futures are in line at best and we could make a reasonable argument for negative.
SPY 1 min is pretty flat or in line intraday
2 min isn't very exciting either. This is one of the reasons I'm looking,
if the 5 min chart were reflecting a "W" base, I'd expect to see much healthier intraday 2 min, 3 min charts.
SPY 3 min with a small positive, however this is not far off from the bounce we have been looking for most of this week.
And of course the 5 min chart from above.
QQQ 1 min looks like it will see an intraday move higher, maybe the start of our bounce?
QQQ 2 min also reflects something similar to the SPY 3 min above, this is about the right size for the bounce we have been waiting on.
QQQ 3 min is in line with the recent negative trend.
And the 5 min doesn't look very bullish to me,
this again is why I'm looking in to all of this when comparing this to the SPY. USually we'd have strong confirmation between all of the averages if that indeed was a larger "W" base in the SPY.
IWM 1 min with a slight positive.
IWM 2 min in line with downside action.
IWM 3 min in line with downside price action.
And the IWM 5 min chart not showing much.
All of the QQQ and IWM charts and a lot of the SPY charts reflect the shorter term bounce we have been looking for in the area and don't raise many questions, the 5 min SPY chart and the Indicators above are what raises some questions for me and why I'm looking in to it so closely.
Intraday TICK is lateral and very choppy as well as volatile.
So I'll be back with you with anything I might find, I wouldn't jump to any conclusions based on the fact I'm looking at this, that's all I'm doing is looking, not saying anything is different.


No comments:
Post a Comment