Here are some quick examples of leveraged ETFs giving not only some strong signals, but giving very nice timing signals as well.
Sharp intraday leading signal in SRTY/ 3x short Russell 2000.
URTY is the opposite of SRTY, 3x long Russell 2000, for a 1 min chart it wouldn't be my first choice because of the volume, but intraday you can see the equal/opposite leading negative at the close.
Here's another sharp signal in the timing chart of SRTY 3x short Russell 2000.
Note the negative divegrence, IT'S TOP/PIVOT IS STILL THE EXACT SAME DAYS, 1/29 THROUGH 2/2 and in between the 2 divergences is an inline signal with the trend.
This is SRTY's longer term 30 min cha, it's in a large leading positive position.
URTY's 30 min long term chart is virtually equally the opposite...
3x long Russell 2000 (URTY) 30 min.
While I can post these charts all day as they are all confirming, it's some of the near term charts that are most interesting. Before I was using 3C or understood it well enough to use it effectively, I use to spend hours every night going through hundreds of stocks, usually spending less than 2 seconds on each, I was watching my indicators and getting a feel for whether there was an overwhelming theme among a watchlist and that would give me an idea of what the market was about to do,
using multiple timeframes and multiple assets with 3C as well as other indicators has more or less replaced that lengthy process, but the idea is the same, since the inverse ETF has its own volume (demand) even though price moves directly inversely, the signals will only confirm if there's something really to the charts.
Here are a few more examples...
SPXU (3x short SPX-500) and its intraday timing chart ,
again with a top right at 1/29-2/2 and a strong leading timing positive signal now.
Contrast to it's opposite ETF, UPRO 3x long SPX-500

The same intraday chart is giving the exact opposite leading negative signal, that's confirmation between multiple assets, not just the S&P ETFs, but the IWM ones as well as what's below...
The long term 30 min trend or the stronger depiction of money flow, negative at the same top at 1/29-2.2 and leading positive now and a large divergence for a longer timeframe like 30m.
UPRO- 3x long SPX-500 on the same timeframe with a base at 1/29-2/2 and a leading negative divegrence similar in size and scope to SPXU's positive.
SQQQ 3x short QQQ/NASDAQ 100 1 min with a strong leading positive intraday timing divergence.
TQQQ, the opposite- 3x long QQQ 1 min with the confirmation signal of a similar leading negative timing divergence.
SQQQ's long term underlying flow on a 30 min chart with a huge relative and leading positive.
TQQQ in the same timeframe with the same large relative and leading negative.
I mentioned FAZ and my belief that Financials bounce tomorrow with FAZ pulling back in what I think will be an excellent buy area or add to. This may be a rotational set up as Tech clearly led with small caps unchanged, the SPX basically unchanged and large caps down a bit. Tech led about the same amount as Financials lagged. If you have paid attention to our S&P sector performance, more often than not, today's leader is tomorrow's laggard and vice versa.
Here's a potential play beyond just a long which I think is about as close to ready as I'd be willing to cut it.
I'm going to show you FAZ 3x short Financials and FAS 3x long financials and make the case that FAZ looks ready to move to the upside, a small pullback tomorrow would make for an excellent entry so we'll start from the long term charts and highest probabilities and work to the intraday timing with confirmation via FAS, the signals should be nearly exactly opposite for confirmation.
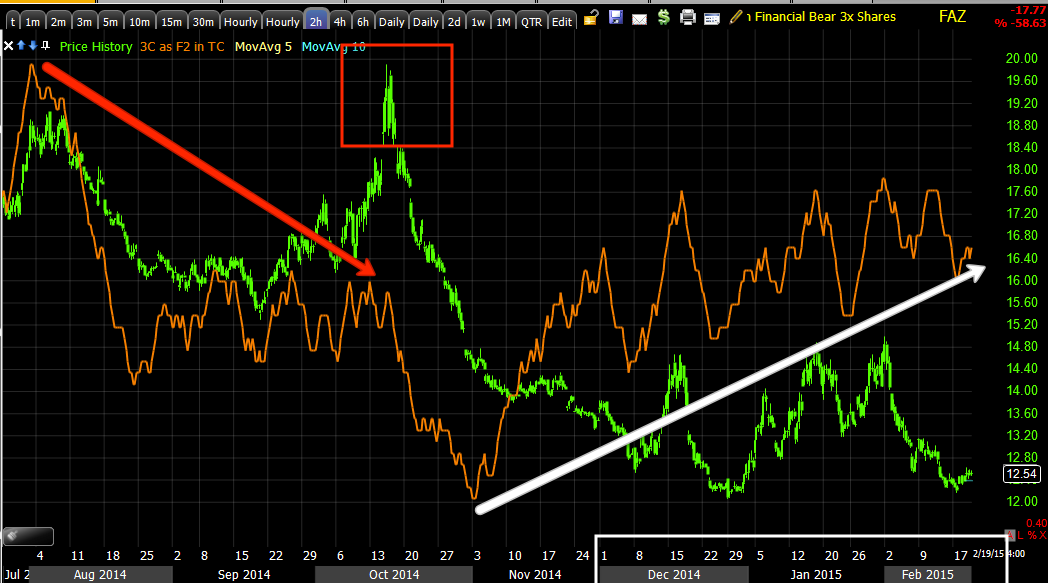
FAZ 3x short Financials 2 hour, just follow the divergences from left to right.
FAZ 30 min which is more of a timeframe for this cycle. Note the dates of distribution.
FAZ 15 min which is again a built up area of 3C accumulation telling me that FAZ looks ready from a strategic view to move to the upside, it has gas in the tank.
The FAS (3x long) 15 min chart is nearly the exact opposite, also note the Igloo/Chimney(upside down) at the base from 1/29-2/2, it's more just about a head fake move and how they can be excellent timing. If you think about the psychology of how traders react, you can understand why they are so prevalent.
FAZ's timing chart at 2 min going all the way back to the market's last base.
And FAZ's 1 min negative in the afternoon today, since this isn't on a 2 min chart, it shouldn't be that strong of a divergence or move, but enough for a small pullback which should be able to be used for either a long position or what I'd prefer, a call position in to very short term price weakness with good timing.
FAS 1 min should confirm...
And it has a positive afternoon divergence as well.
XLF 1 min doesn't show any divergence (positive) like FAS although it should, but as I said, often leveraged ETFs show divergences that the underlying doesn't when it comes to finer details.
XLF 1 min.
FAZ 1 min. What I'd like to do is use the weak negative signal that should rotate financials tomorrow and pull FAZ back a little to enter a call position, whether FAZ or more likely XLF, this is because it's a very small, short term signal being it's not on XLF and it's not even on a 2 min chart. It should provide a discount on the call and an edge.
Overall though, between all of these ETFs both leveraged and inverse leveraged, there's a ton of confirmation from long term right down to very near term timing charts.


No comments:
Post a Comment