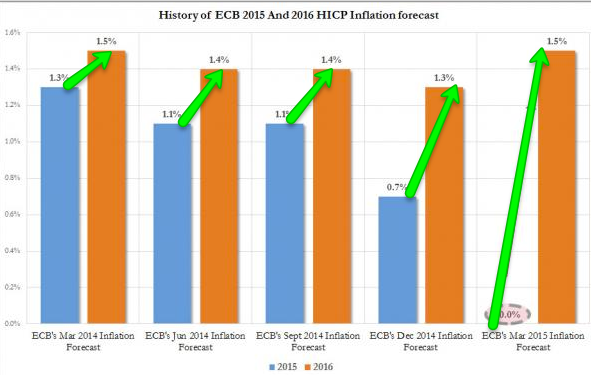
What I don't understand and it's not all that important that I do as I'm not privy to insider information, is why gold would be an asset that would gain in value when all indications are generally pointing toward deflation or at least the perception or fear of deflation except in Mr. Draghi's case who forecasts inflation to go from 0% in 2015 to what they call a "Hockey Stick" save or recovery and print 1.5% in 2016, to give you an idea of what that would look like...
OK, so maybe Draghi knows someone in OPEC and knows exactly what they are going to do as the downward revisions to ZERO have been blamed on cheap oil, to me it seems like one of the wildest, unsubstantiated guesses a person in that position could possibly make.
However, the market is about perception right? It's just the perception about Mr. Draghi is not exactly one of trust and commitment.
The reason I mention this is that usually gold is bought on the EXPECTATION of inflation and with central banks mostly coming out on the side of, "Near term we expect more deflationary pressures" (not suggesting outright deflation, but the lowering of inflation expectations; the F_E_D has done it, the ECB certainly has done it.
We know that the F_E_D needs some excuse to say they expect inflation to move toward their long term goal of 2% so to get done what I think they need to get done, inflation has to start to ramp up so maybe Draghi and the F_E_D know something that we don't whether it's real or subterfuge.
Or perhaps there's something else to it.
In any case, I just follow the charts.

You might be very tempted by the 30 min leading positive divergence since the pullback has gone lateral (typical base building or a reversal process), but I'd probably let this play out a bit longer,
Take a look at price inside the white box, does it not look like the common "W" bottom could form with a slightly deeper pullback to the recent former lows inside the box? To me it does, which may also see a head fake move below defined support by the time such a price pattern were in place. Assuming that were the direction GLD was moving in, I'd want to be long on the head fake below the support level of the "W" pattern, not only for the better entry and lower risk, but for the excellent riming cue head fake moves give.


The 5 min chart shows near perfect downside confirmation on the pullback after the negative divegrence and a clear positive divegrence since price started moving sideways.


When the short term charts start going positive, they are showing us timing or what I'd call the tactical outlook , the area and time we'd consider an entry, so I don't think we are there yet for more than 1 reason, but I think we are going there.


No comments:
Post a Comment