I'm not one at all to brag or take victory laps or claim to be a guru, but considering there were only marginal divergences Tuesday when we closed down the QQQ and AAPL puts and those decisions were largely based on the way price was behaving, volume and volatility, I think it is a testament to how strong our concepts are which have all been revealed through 3C charts over the years to the point in which something is seen so often, that it becomes a probability and then one of our concepts.
Whatever kind of trader or investor you are, if you get nothing else from the analysis here, I hope it is that you learn how to apply these concepts to your own trading (which to become a concept must be fractal meaning working in any timeframe and for any asset).
I posted quite a lot about volatility recently and what it looks like, what it means at different areas of the market. In our particular stage, volatility is extreme, it's typically fast moving and it can run-over otherwise solid signals, but this is a concept beyond simple volatility and gets more in to mass psychology and the two forces that move all markets, Fear and Greed. Fear is the stronger of the two as evidenced by how much faster a bear market erases a bull market's gains, at least 3:1 and in some instances much higher like 5:1.
Additionally market structure and breadth such as the percentage of stocks above their 40-day moving average as we are barely removed from a recent all time new high being almost half of what is normal for a bull market and less than 50% in hard number terms, makes the market exceptionally weak and like an immune system that is severely compromised. Small events like the common cold that would normally not cause any significant changes could be life threatening. The fact that the market is trading at Current P/E's that are associated with tops and that these were reached not by productivity, but by issuing debt to buy back stocks and the fact that there's nearly $ trillion dollars in accommodative policy that got us here that needs to be unwound or something as simple as margin debt being at record highs meaning a small decline forces margin calls and selling that quickly turns in to something much larger than the fundamentals of the market would otherwise create.
My point is simply this, I have to watch the market very closely for any signs that a steam roller is heading our way, which is fine with me from a positioning standpoint, but for additional positions or trade management, it's crucial information. As of now I expect a bounce to continue as it has barely moved in anything other than the IWM, as such there's usually not a lot to do from an analytical point of view other than to wait for it to run its course, but in the place we are right now, there's an increased danger of volatility over-running otherwise solid analysis, it really doesn't take much.
On that note, here's a look at intraday trade...
Since this morning's short squeeze in EUR/USD, we forecasted that the sort squeeze was done and the probabilities favored the pair heading back down, they have been lateral since the A.M. update and toppy looking so it would not surprise to see the [pair move lower.
Intraday ...
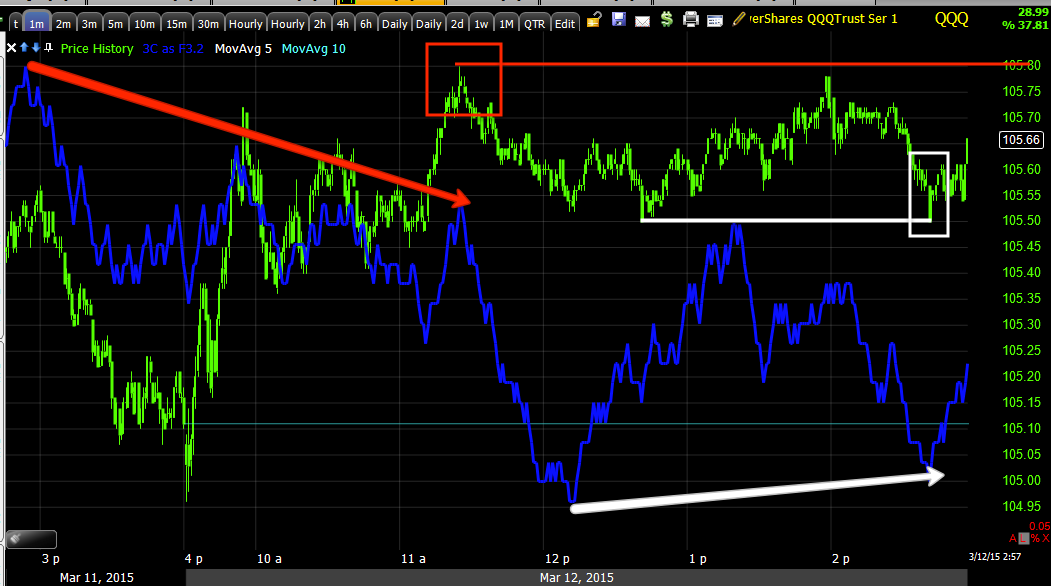
QQQ 1 min has barely moved, it has not left the base area as of yet and is underperforming the SPX by about 50% on the day.
The early negative divergence this morning has held the Q's at levels below the intraday a.m. highs, but recently there has been a small positive divergence, remember despite the +.64% gain on the day, the Q's really have not even left the base area as of yet as you'll see.
The IWM continues with upside gains and can be considered a bellwether for the market overall as it has seen distribution in to stronger prices as was expected Tuesday morning on a bounce and as would be expected just from a staging point of view. Unless a significant base has taken shape which it has not, we are in stage 4 decline which means the probabilities of any bounce are skewed heavily toward distribution and failure as the dominant stage/theme are set to continue.
The SPY saw some early 3C inrtraday weakness that has kept it too in a range with no further gains on the day after the a.m. session highs, but like the Q's, it too has seen a late day positive divergence on a 1 min chart.
Interestingly, the Custom TICK/SPY indicator which shows market breadth as you'd expect (stronger in to stage 1 after capitulation, weaker in to stage 3 and stage 4 with recent and small strengthening in to our bounce area.
Taking a closer look intraday...
Through this range of SPY intraday after the a.m. negative divergence, intraday breadth has declined substantially, not a lot on the scale of a bounce, but something that could be the tinder that starts a larger flame and must be watched over.
Intraday NQ futures saw a head fake move, check the volume and the 3C accumulation as they hit a low. Otherwise, nothing special here other than in line.
ES/SPX futures 1 min show in line early with a negative and a little weakness, but again, nothing I'd really be too interested in.
TF/Russell 2000 futures are showing a bit more negative action,
that's likely because this is the only average that has given the market something to sell in to as you'll see.
On a 5 min ES chart, we already know we have a divergence at this "W" or lateral base/bounce low, you can also see that despite a +1.2% gain today, the SPX hasn't even left the base area yet.
The same goes for the Q's as this is the 5 min NASDAQ futures.
Here's where it gets interesting...
TF/Russell 2000 5 min futures look very different and are negative, but as you can see, they are the only one that has clearly moved out of their base area and given the market price strength to sell in to, that's what this is all about, selling//shorting in to price strength, the exact same thing we were /are looking to do as we closed Put positions Tuesday expecting a bounce.
The 10 min charts offer additional information and perspective, again ES 10 min has barely left the base area so you can't expect selling in to an asset that for all intents and purposes is yet to make its move.
The same is true of NASDAQ 100 futures on a 10 min chart.
Again however, TF/Russell 2000 fuures have a wickedly nasty negative divegrence bas they are the only average that has given the market / pros something to sell in to.
Again, if I feel that the IWM is in an area in which it won't just move higher or stay put waiting on the other averages and rather looks to diverge to the downside, I'll put out trade ideas, Puts, inverse ETFs, TECS, etc.


No comments:
Post a Comment