Thus far there are several leading indicators or correlated assets that are in support including HYG, although it's looking weak so I wouldn't be surprised if a bounce like this opened volatility up and the market fell hard from here. Yields are also running higher today in support of an intraday bounce, I probably don't need to tell you the negative pressure they are exerting on any chart longer than today's intraday. Pro sentiment indicators are in a helpful spot for an intraday bounce as well.
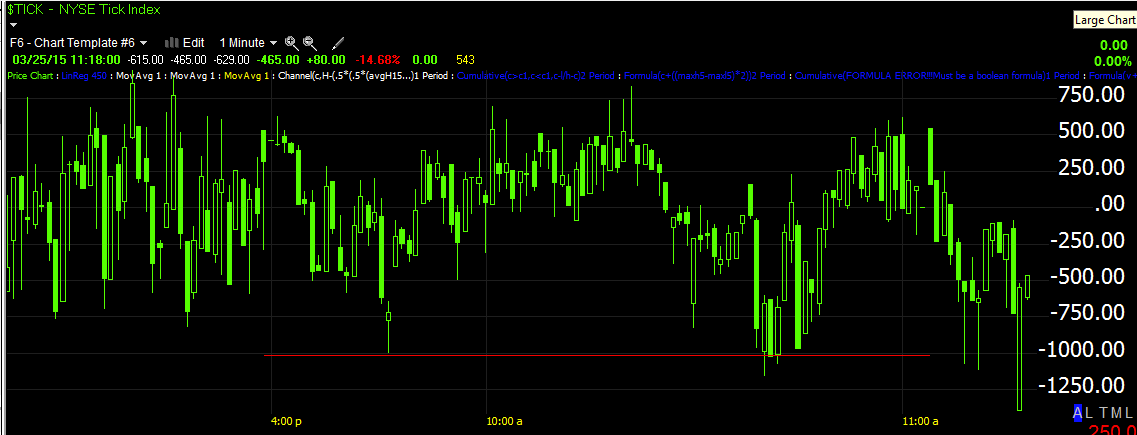
One thing to be on the lookout for is just like a large stage 4 cycle, CAPITULATION which would be represented by a large volume spike or larger than normal for the area and typically a large negative TICK reading, that would represent a short term selling event or exhaustion event and open the door to a bounce. We may already have that, just recently in fact.


As I said yesterday, this is NOT an impressive divegrence, but internals are in the right spot to allow for a bounce and there are other indications that are supportive such as HY Credit and Yields as mentioned above.


In any case, watch volume as well especially with candlesticks.
In my view, I would not try to play this on the long side unless there was a signal so amazing that it couldn't be ignored and I doubt this is that kind of bounce. I would use any price strength to sell in to, this is the closest to a win/win scenario without introducing needless risk.
Remember it's early in the day, a trend change often follows the European close which just took place.


No comments:
Post a Comment