Not much has changed since Friday's Week Ahead forecast and the clarification this morning with more details. If anything has possibly changed, it may be that the additional bit of base-building expected this morning may not occur, chalk it up to AAPL or simply the very oversold breadth from Friday on a 1-day basis.
Here's what things look like (although some of the 1 min charts have since changed a bit, the theme is still the same.
SPY 2 min chart with a negative in to Friday and a positive in to late Friday. I expected price to come down a bit this morning (green arrows) and widen out this little base that would be responsible for the early week strength.
This 1 min SPY chart shows why I expected that, intraday today it has some weakness suggesting an intraday pullback, but the larger picture above (still very short term) has the look of simply broadening this small base out a bit.
Because the 1 min SPY divergence is still in place, I still think it's a probability.
The QQQ 1 min is more in line, it doesn't look like it wants to pullback intraday. I suspect this has more to do with AAPL and the watch being unveiled today.
Last week I did close 1/2 the March monthly AAPL put position hoping to take those gains and let AAPL bounce near term, then add the put position back at full strength. I'll specifically update AAPL today.
I showed the Q's longer term cycle/chart at 30 mins and how ugly it is,you've seen the Index futures at 60 min and how bad they look in the same area, so again, early strength this week doesn't change anything about the forecast for the rest of the week or more broadly the continuation of the stage 4 decline which has really just started, remember the example from the August cycle and the September to October decline as a example.
The IWM also doesn't look like it wants to pullback. Normally I''d say the IWM should lead any move, but right now in my view, it has the weakest underlying 3C chart of the bunch, this may translate in to weaker relative performance.
And of course the longer term chart or the highest probability chart is showing exactly what was expected when we forecast a pop above the market's range that had been in effect through all of January and then some. Expectations were for a head fake move not confirmed, and more so, a head fake move setting up a large stage 4 decline that breaks below the former October lows. As you can see, now that we have seen the head fake move (which was completely retraced in several of the averages Friday), 3C showed us exactly what I expected to see, heavy distribution in to the move confirming it was a head fake as well as price action from Friday completely retracing the entire move just in a few days.

This is my custom NYSE TICK vs SPY indicator on a 1 min chart. Note Friday's intraday breadth going from bad to better and moving to neutral today, this is very much in line with the early part of the week's forecast for early strength, but again, it's not something I'd want to buy, but rather sell in to or short in to.
Probabilities are just too skewed against the market not only in 3C, but in many of the breadth and leading indicators, see HYG below.
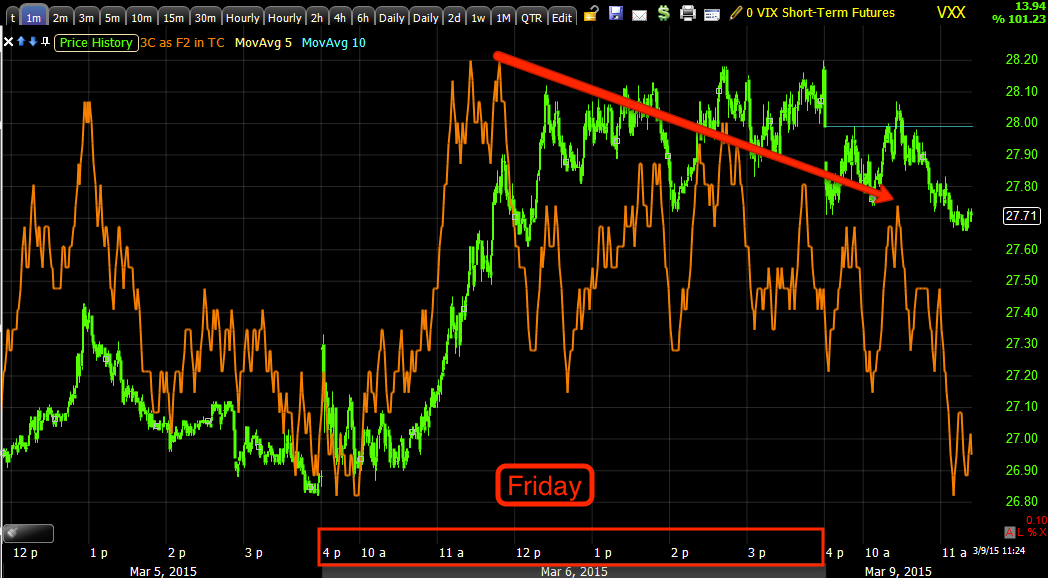
As for VXX (Short term VIX futures) and our UVXY long, again I could have made the decision this morning or Friday to take gains off the table, but as I posted last week, "Plan your trade, trade your plan and use the right tool for the right job". The UVXY position wasn't meant to be a trading position although I can't blame anyone with the time and aptitude for it, to trade around the clear signals we have had in VXX/UVXY, but this 10 min chart not only has lost the downside momentum just like the market lost the upside momentum (the two assets trade opposite each other), but
the 3C chart here shows a large base in VIX futures and that's the trade I'm targeting with UVXY, thus I'm not trading in and out, but keeping it in place to take advantage of this larger base and trend that looks ready to add to the gains already established in UVXY long.
This however, is not why I posted VXX, this is...
Intraday on a 1 min chart, there's the same negative divergence from Friday (confirming the 1 min positives in the averages) for early week market strength, as the VIX trades opposite the market, this negative 1 min divergence confirms everything else in our forecast.
Again , I'm not interested in trading around VXX/UVXY, although the signals are very clear for anyone who wishes too, I'm looking at the chart above this one and the larger trend.
As for TLT, remember our pullback call (10 min chart), there it is in red and the trade that went with it (short TLT or long TBT 2x short TLT) which was closed last week as I don't see the return being worthwhile now that the short term scalp trade has put in most of the trend, from here it's chop and I don't see the value in hanging around for that.
Yields move opposite bonds/TLT and tend to attract prices toward them so the short term weakness in TLT today also confirms our forecast for the early part of this week, however, the reason for closing the TLT short is the probability of a move higher in TLT and lower in yields pressuring the market to the downside in line with the larger forecast for the market already in stage 4 decline from last week. In other words, I'm more interested in which way the tide is going than watching the waves, although we are using the waves for tactical positioning.
I believe this move in TLT under clear support is not only to help the market for the early strength, but also a head fake for the timing of TLT's larger base and move to the upside expected (which fits with the continuation of market weakness as we entered stage 4 decline last week after some early strength).
And TLT's 1 min chart with a negative divergence on this little pop up this morning.
HYG would be the first asset to be seeing strong 3C positive signals if we were to see something more than early strength or noise/jiggles early this week, but the trend has shown the distribution we saw in HYG has become reality in price and the divergence in price between Credit and the market is a very red flag for the market.
Not even the 1 min chart shows any kind of positive activity for HYG, which I think is strange as I'd expect at least a small bounce intraday or for a day, rather 3C called the reversal and has confirmed the downtrend since. The further HYG diverges from the SPX, the harder the catch down the market will experience.
So far, so good, everything has taken shape and fallen in to place from our week ahead forecast and the fine tuning this morning.


No comments:
Post a Comment