This however has larger implications as I showed last night, yields which move opposite bond prices are a great leading indicator pulling equities toward them as if they were a magnet and the examples I showed yesterday and in the Daily Wrap show movements in the SPX that are in sync almost exactly with yields.
I think there's more than 1 influence that's in effect at any one time, say for instance NASDAQ 5k or the Actavis Bond offering that closed yesterday. With Treasuries specifically assumptions or perceptions about the timing of rate hikes and the extent have a lot to do with their movement as well, so it's not very easy to break down a simple correlation like HYG (Nigh Yield Credit) diverging first in 3C last week and before and then in price this week, which has been a strong leading indication for us.
However, as I can't predict what market players / bond traders are thinking and likely they can't predict what many others in the same field are thinking, I have to break it down to what I see on the chart.
With HYG already divergent and in decline, and with the divergences in VXX and UVXY as per the Trade Idea: UVXY (VIX Short Term Futures) and charts, TLT is the 3rd of these 3 assets that have a lot of pull on the market (HYG lower, TLT higher and VXX higher= SPX lower). We already have HG moving lower in divergence with the SPX, as mentioned, you know I like VXX for a move to the upside as it has been doing and finally TLT moving up lowers yields which have this effect both short and long term.


Even intraday the Leading Indicator is heloful, this is today on a 1 min chart, SPY in green vs 30 year yields in red, the areas marked on SOPY are positive, negative divergences and in green, in line or moving together as they typically do.
So a change in TLT/Treasuries is a change in yields which as you can see with HYG and VXX already showing strong signals, is more than likely a change in the market which is just additional clues to the evidence already collected.


As for the TLT charts, they are more detailed...

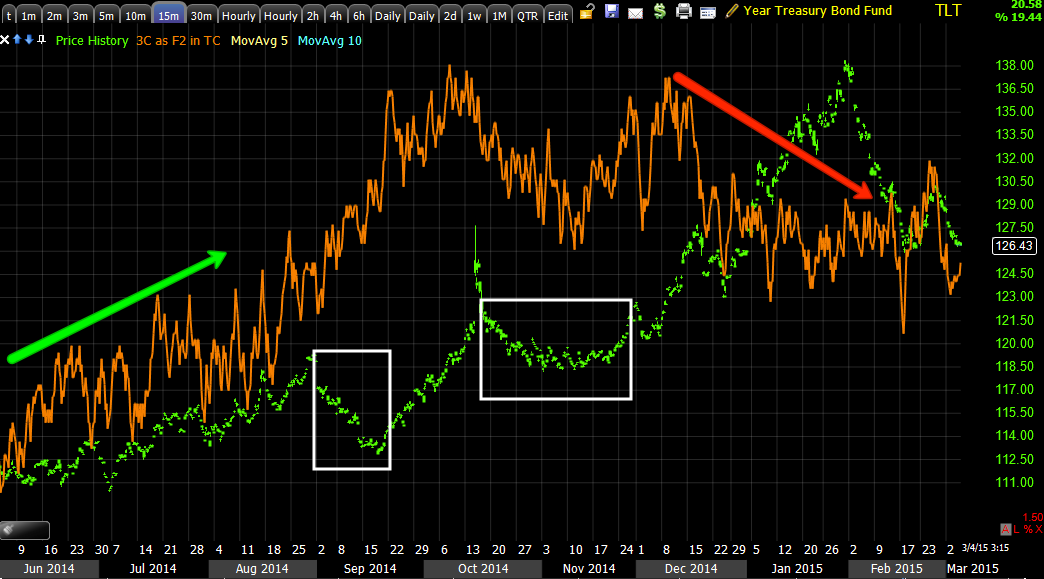

Again, on this chart the first vestiges of a positive divergence are showing up and like Treasury futures, they are starting this week.


Rising TLT means lower 30 yr yields which means the market which has been following yields like a puppy, follows them lower.
HYG, TLT and VXX have a special place together when moving as described above called the SPY Arbitrage, VIX up, TLT up and HYG down pressures the market down.
It looks like the 3rd piece of the trio is falling in to place.
While I'm not a huge fan of trading TLT because of the beta, there is the leveraged TBTR which in this case would have to be shorted, still the point is the influence on the broad market.


No comments:
Post a Comment