There have been many theories as to why the price of oil declined from imposing a kind of sanction on Russia, an oil exporting nation for their actions in Ukraine and Crimea to that act being driven by the US and suddenly turned on the US by OPEC/Saudi Arabia to crush the ?US Shale Oil Industry who can't produce a barrel of oil for what the current market price is, thereby wiping out the US shale producers and leaving OPEC and some other large non-OPEC producers in complete control of supply and demand once again. An advisor for the Saudi minister of petroleum recently went on record about reasons given to the Bank of England's Mark Carney when he asked 1) What caused the price decline and 2) where oil prices were going. The answer about what caused the price decline seems to be, "I
t was all perception and conspiracy theory, herd mentality that secret actions were being taken to hurt one country or crush another's oil producers and he claimed it was all non-sense conspiracy theory that had actual results as we know all too well, Perception drives prices, rarely is it fundamentals and as to question #2) While the general answer was "If I knew I'd be in Ls Vegas", the broader sentiment was hopeful for the future of oil prices stabilizing and rebounding based on real supply and demand fundamentals. To me, all of this makes about as much sense as the F_E_D tightening policy right now (as I have said, I don't think the F_E_D should be sitting at 0% rates for the last 5-6 years), but on a macro data basis, if one looks at things objectively, it's hard to justify a tightening cycle based on the horrible macro data since Q4 2014 through present. Yes the F_E_D's current policy is that of EMERGENCY action and no we are not in an emergency situation, therefore some balance seems reasonable, but the way things are going, it doesn't make a lot of rational sense to tighten right now as everything in the US and globally has weakened and the F_E_D inflation forecasts have been dead wrong for 2+ years now.
That being said, it seems they are and have been on a course of tightening, they have tightened just by ending QE and it seems they will again. The point is, it seems the F_E_D is much more worried about something that's not out in the main stream press, unless the macro data coming in as bad as it has been is the answer hiding in plain view. Meaning the F_E_D's policy is so wound up, there's no room to deal with any new recessions or economic shocks, therefore they maybe need to create some room or they simply see or are worried about something that we are not privy to. In the same way, I don't know what really caused oil to drop as it did, I only know that SOMEONE knew in advance and someone seems to know now in advance.

For instance, just like our candlestick (reversal) concept and higher volume making those signals more probable by 300-400%, the same is true of oil, you just have to look on a larger timeframe like monthly...

As for conspiracy theories, I don't know and beyond simple curiosity, I don't care. The market told us back then that something was not right with oil, someone knew something whether it was part of one of the conspiracy theories or something else altogether than we haven't heard or.

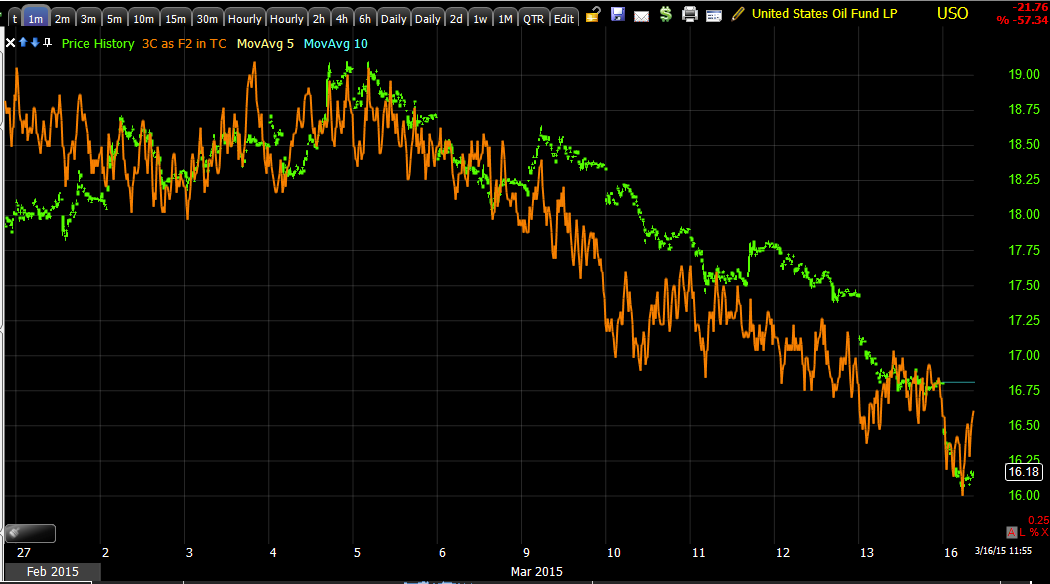
In similar manner, the current signal is the polar opposite. While the pundits either call for lower prices and celebrate as oil moves lower or they call for a bottom and are heart broken as they see oil move lower, we've had a different perspective, one that we just saw on an intraday basis in the SPY and QQQ last week leading to today's price action. The concept is EXACTLY the same, the timeframe is different, a "W" bottom. The 3C chart above suggests that someone with deep pockets believes or is making sure this is a bottom and I know of investors that have large oil tankers sitting off the coast just holding oil and waiting for prices to rebound so they can start selling them so they obviously believe for their own reasons.

This is a close up of the 2 hour chart. Since we had called for a break below a descending triangle last week and prices have moved that direction, this chart hasn't moved, that's simply because to move a chart like this you need to have a huge amount of accumulation or distribution. If our theory about a wider base or double bottom was correct/is correct, then we wouldn't expect to see accumulation until we reached the area of the first low which we just hit today, therefore accumulation if anything, would be just starting and certainly wouldn't be reflected on this long of a chart. The other side of the coin is the decline we have forecasted and seen, is also not creating large distribution. If you are a large firm or "Deep pockets", you don't want to give up the shares you accumulated on the cheap if you are only half way through your accumulation. Unlike us, they can't place a full order for a full position size at once without sending price way against their position and having every predatory algo and every human trader with half a brain front running them, it's done in pieces which is why we call it a "Process", not an event like our smaller orders would be considered which have no effect on the market.

If you note the trendline, I also forecasted that as with almost all double bottoms (like a "W" except larger) we'd see a head fake move BELOW support, this is where I'd want to buy USO or add to it , but this is likely to be a process as well in line with the size of the base, not a 1-day event.


How can we play it from here? Well first we have to confirm our theory is correct, but thus far everything I see says it likely is and we need to get signals strong enough that they move the 15 min , 30 min and maybe even the 2 hour charts. This is not going to happen in a day, probably not in a week, it is a process and you can probably gain some insight as to how long it will take by looking at how long the first area took and imagine the symmetry of the price pattern, they tend to have symmetry. Don't forget the head fake move. In order to steal shares of the long who believe oil is headed higher, they'll have to scare them out of their shares which means creating a head fake move lower that is scary enough to cause the emotional response to activate and sell the shares on the cheap, this is where I'd like to be a a buyer, so you can use your own emotional response to price as a barometer, if it scares you and makes you doubt any base is possible, it's probably the right area to buy, but these responses are extreme to knock out the hardest core longs.
As for where oil is going, I can't say beyond making a price pattern based guess, but with a primary trend reversal, I think that guess would be on the low side. Who knows what is causing smart money to accumulate, perhaps they know something about future opec plans which may be to say, "Hey, there's so much oil in reserve, we can cut production down to a trickle because if we don't, they can just sit on those reserves of cheap oil for a long time and no longer need to buy from us" as the reservoirs are nearly full in the US alone.
Thus, this may have NOTHING to do with global growth and demand and everything to do with production quotas being severely cut. Whatever is going on, there's a reason for it and someone knows why, we're just trying to follow that someone and we'll understand later , hopefully after we are sitting on a large profit why exactly price reversed higher as I anticipate. Again, just a point of interest by that time.


No comments:
Post a Comment