The US Cash Markets are closed tomorrow so hopefully you will get to...

As for myself and the lovely and talented Andrea, well I don't get much vacation time, certainly no two weeks a year, not even a week, I get 3-day weekends when we have holidays so we'll be hitting the road as soon as publish this post and headed for Orlando and Tampa as we ramble across Florida.

In any case, last night's Internals, Dominant Price/Volume Relationship and Sector Performance indications were right on as well as the Daily candlestick (bullish hammer reversal at the 100-day) all did exactly as suspected and posted a mildly green day today.
From last night's Daily Wrap, Leading Indicators: A Tale of Two Tells
"The Dominant Price/Volume Relationship came in...at Price Down/Volume Up which is one of the strongest near term oversold relationships that usually sees a green close the following day....
In addition, of the 9 S&P sectors 6 closed red with Materials outperforming at a meager +0.29% (barely a positive close for a leading sector) and lagging was Healthcare at -1.01, more in line with the Dominant P/V relationship.
Of the 238 Morningstar groups, only 92 closed green. This is also in line with a slightly oversold bounce, but not so much so that I would expect anything very impressive"
You see, there is a method to the madness and more than that, Volume Analysis , a lost art for most traders, can tell you a lot about the market.
On the day, the averages were green except Transports which are still looking very ugly (one of our favorite core short positions we've been holding and will add to given the chance).


Sector performance on the week saw Health Care lag.
Yellen spoke today at the St. Louis F_E_D's Community Development Conference, and while she didn't address monetary policy (we'll leave that to James Bullard), apparently her soothing droning provided just enough boredom for the market to feel comfortable putting in some gains. Of course I say that in jest, the market was very short term oversold as the internals posted above showed last night/yesterday.
I didn't see what I would call a strong 3C signal for where the new week will pick up, most of the averages closed just about in line intraday, not giving us the hint of how they'll open Monday, but one looked a bit weaker than the others, the recent out performer Russell 2000/IWM.

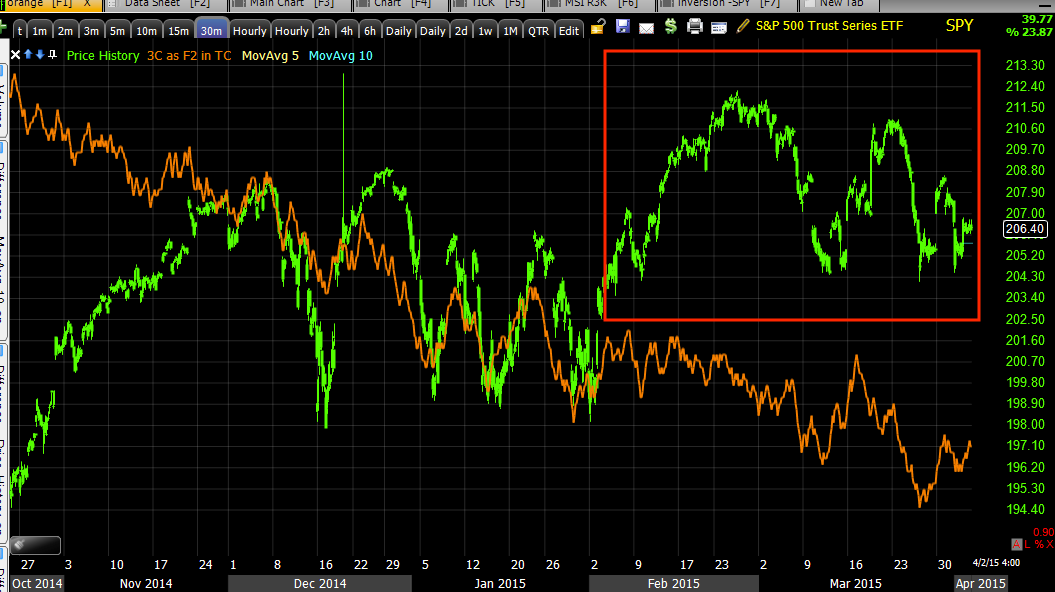
As for the SPY...

IMPORTANT: AAPL Set-up & Market Movement
This uses AAPL as a market proxy after having looked at about 20 individual stocks that are on my "Short" short list, I noticed a trend among them and the post above is the closest thing to a near term forecast as the market hasn't given us much to work with beyond the downside we expected for the week and forecast last Friday.
Even scarier if you are a market bull...


Intraday our Leading Indicators weren't screaming, but gave some near term clues.

The SPX:RUT Ratio (red) vs the SPX (green) shows little support for the market after leading the market a day or so ago to today's higher prices. Note the lack of support in to the close (yellow) and the effect on the market intraday.

Yields overall on the week (5, 10 and 30 year) looked like this.

IMPORTANT: AAPL Set-up & Market Movement
The intraday move was to the upside which is in line with the forecast linked above.
STRANGELY CONSIDERING TOMORROW MORNING'S 8:30 A.M. NON-FARM PAYROLLS DATA (the most important payroll data of the month and closely watched by the F_E_D as discussed earlier today), VIX short term futures underperformed the SPX (price inverted of green SPX so you can see what the normal correlation should be and VXX's underperformance).

There's also MAJOR Greek default risk as they still haven't secured a deal for short term financing and have some major bulls coming due that could put them in DEFAULT. Perhaps they will adopt the BitCoin as the Greek Finance Minister oddly commented this week (have you seen the volatility in the BIT COIN?).

Does the market TRULY know something they shouldn't about tomorrow's NFP? A leak perhaps?
My forecast posted today wouldn't be opposed to such a possibility, but if there's no leak, this could truly be one of the more important events as far as perception goes on a F_E_D rate hike and the timing.
While traders weren't buying protection in to the long and uncertain weekend, Pros were.

Note HY Credit being sold off vs the SPX as professional traders sought to reduce long risk in HY Credit.
Beyond that, we have today's internals...
Today's Dominant Price/Volume Relationship among the component stocks that make up the major averages was nearly the opposite of yesterday's, although unlike yesterday's 1-day oversold condition pointing to a green close today, the Dominant theme today may be a little too new to cause an 1-day overbought condition, but that's essentially what it is.
Once again, the Russell 2000 had NO Dominant Theme as it has been for well over a month which is very odd. However the Dow was dominant with 10 of 30 stocks in the Close Up/Volume Down relationship (one of four possibilities). The NDX 100 had 64 and the SPX-500 had 282, all dominant, all Close Up/Volume Down.
As you probably know just from normal stock volume analysis, a close higher on lower volume is bearish, in fact of the 4 possible relationships, this is the most bearish which I believe is just a reflection of the overall market's tone. A strong close would be up with increasing volume, this is the exact opposite of that as far as the implications go.
Of the 9 S&P sectors, 8 closed green with Consumer Discretionary leading at +.89% and Tech lagging at -0.02%, just barely red.
Of the 238 Morningstar groups an amazing 202 closed green.
Normally I would call this a 1-day overbought condition, but because of the small daily gain, it doesn't feel that way, but technically I should call this a 1-day overbought condition which would normally result in the following day (Monday) closing red.
I suspect we had a lot of traders taking the week off, especially after window dressing at the end of March.
I suspect the lack of decent signals, which was actually a good thing as we wouldn't want to enter positions and be stuck in this...

This chop over the last week or even longer that has been getting worse, this has been killing a lot of short term traders, THUS THE WEAK SIGNALS HAVE BEEN APPROPRIATE, LEST WE GET CAUGHT IN THIS.
However, if you saw today's forecast, things could be changing very soon, thus I'd expect 3C charts, Index futures, and leading indicators to show us a lot more in the coming week.
That's it for now, I'm getting ready to get on the road for our first 3-day vacation...

Have a great weekend!


No comments:
Post a Comment