The closing negative divergences in the market on Friday played out just as we'd expect on the 3C concept of the market picking up where it left off on the previous close, even over a 3-day weekend and that was with a horrible negative divergence.
 I also mentioned that we were in the reversal process of what I believe will be an Igloo top with a Chimney. I posted this chart of the "Igloo" on Friday in the The Daily Wrap with the following chart and commentary (remember this is from Friday)...
The concept of 3C charts picking up where they left off in the cash market even over a weekend or even a long holiday weekend, should see the positions entered this week at a gain early next week as today's closing 3C charts/signals are all reflecting early weakness which would be in line with the "igloo" price pattern finishing before the head fake Chimney which "should" allow us to take gains on the new options positions as well as enter new, longer term positions on the head fake move right after booking gains on the new positions above on early week weakness."
EVERYTHING POSTED ABOVE FROM FRIDAY PLAYED OUT PERFECTLY TODAY.
We closed the Put positions in QQQ and IWM today at a gain on today's weakness as the 3C charts foretold Friday and closed the VXX calls and the TLT Calls at a gain as well. This further created the Igloo in the QQQ above as forecasted Friday, but with significantly more weakness than the normal rounding of the "Igloo top" portion of the price pattern...

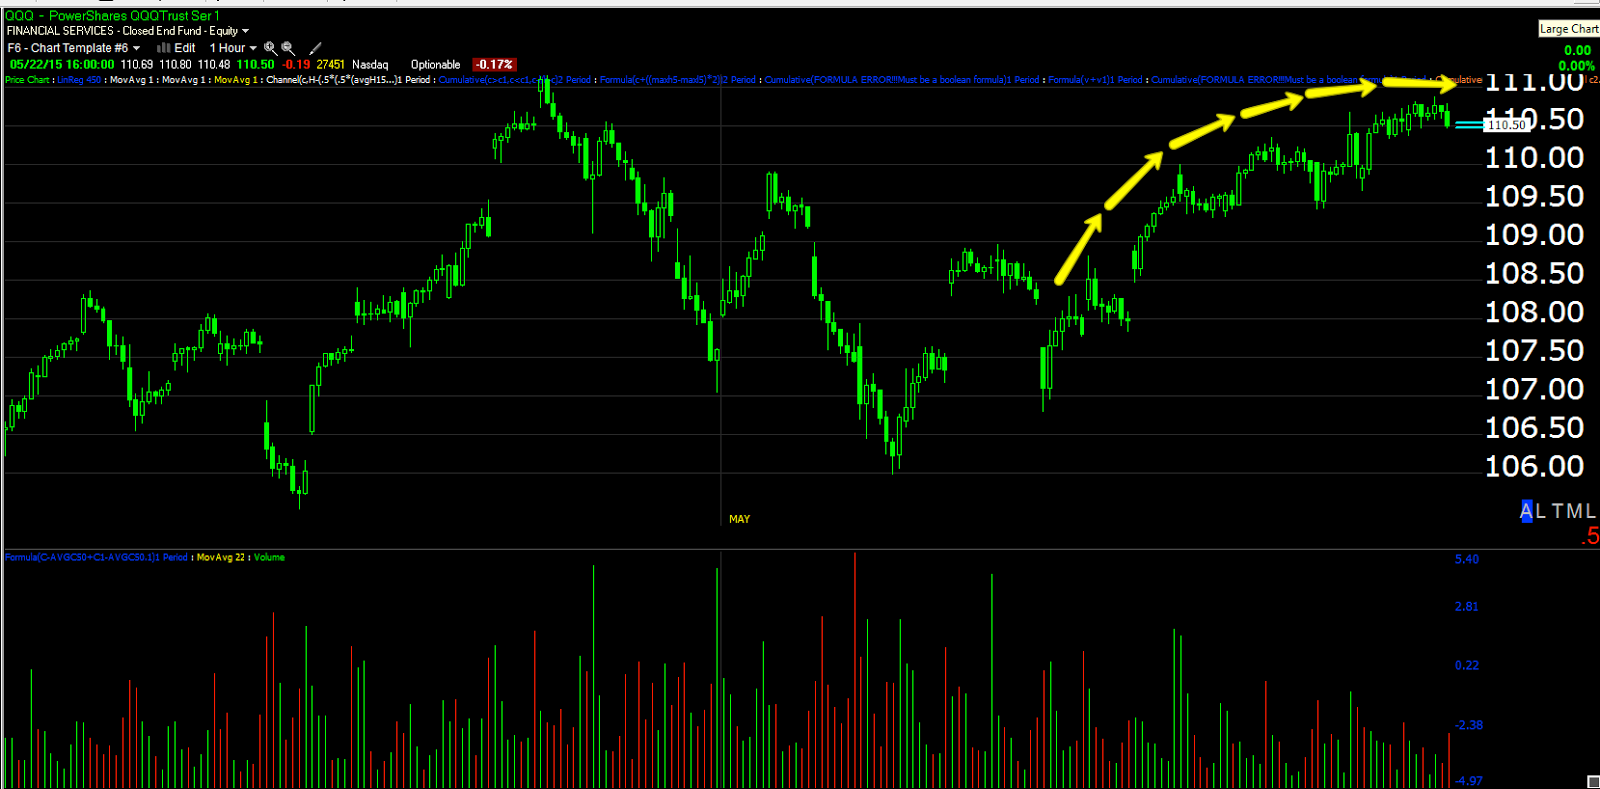
Normally we would look for the head fake "Chimney" on the right side of the "Igloo" rounding top formation, in this case it would look something like this...

Incidentally today, the positive divergence needed for a move up were VERY present, thus our entry in VXX and TLT puts today after closing the call positions at decent gains in VXX and TLT, TLT & VXX Follow up (P/L) and charts with a smaller VXX +2.5% gain and a larger TLT +50.4% gain today.
Shortly after we reversed positions and entered TRADE IDEA: SPECULATIVE TLT PUTS and TRADE IDEA: SPECULATIVE VXX Puts, both with decent , but very short term positive divergences meaning while we may get a decent move, it should be short lived, along the lines of the "Chimney" move to the upside as I mentioned we could have entered SPY, IWM or QQQ calls as well, I just liked the VXX/TLT charts better.
Adding to the weakness today, the spot VIX saw the biggest percentage move of all 2015 at +15.9% and the $USD has now put in the strongest 7-day move since 2008 on its counter trend bounce.
Interestingly, adding to the probabilities of today's new positions entered and a near term / short term market bounce, Internals WERE EXTREME!
The Dominant Price/Volume Relationship was in all 4 averages with an amazing 72 NASDAQ 100 stocks, 27 Dow 30!!! There were 1058 Russell 2000 and an amazingly strong 368 SPX-500 stocks all in the same Dominant Price/Volume Relationship of 4 possibilities... Close Down/Volume Up which is the strongest 1-day oversold condition of the 4 possibilities usually leading to a next day move higher as our intraday divergences suggested, those being the reason we entered the TLT and VXX puts today after closing out the calls at a gain as forecasted Friday!
Furthermore internals were exceptionally strong with all 9 of 9 S&P sectors closing red with Utilities leading at -.63% and Energy lagging at -1.58%!!!
OF the 238 Morningstar groups I track, an amazingly overwhelming 231 of 238 groups closed RED, this is a VERY strong 1-day oversold condition and especially taken with the Dominant Price/Volume Relationship of the 4 major averages. This CLEARLY suggests a next day close in the green on a very strong 1-day oversold condition. However remember the positive divergence were at best a half a day long, exceptionally weak for a bounce suggesting exactly what we have expected, the market is getting ready for a very serious turn to the downside so we'll want to be selling short in to any price strength with decent divergences.
As for futures tonight...
The short term 3C charts suggest exactly the strong, but very short term bounce we expected by the intraday 3C charts today. Here are the Index futures in several different timeframes for a bounce, but notice how small the divergence is unless we add to it tomorrow, which seems unlikely given internals tonight...


As for the charts that count in looking for a bounce that fails and leads to a strong downside move...


This all suggests the short term move to the upside we expected both last week (after initial early week weakness which we saw today) and on today's divergences creating the Chimney portion of the "Igloo/Chimney" price pattern which is a downside reversal price pattern , especially with these 3C divergences.
We'll be looking to take gains on positions entered today adding to the QQQ, IWM, VXX and TLT gains all booked today (+2.5%, +6.3% +50.4%, and +83% all booked today).Then we'll be looking to enter new longer term swing/trend shorts on any price strength. Today saw exceptional damage done to the market beyond the percentage moves and way beyond the exceptional damage of 2015. I suspect we may even see the move down (the one that challenges the October lows and moves below them eventually) begin later this week.


No comments:
Post a Comment