This is that bit about
"Patience" that so often pays off.
I see signs the market is moving toward a more sustainable base that should be able to meet the forecast from last Friday's
The Week Ahead post. Specifically...
" I believe we will see early weakness on Monday. HOWEVER THIS PART OF THE FORECAST IS NEAR MEANINGLESS COMPARED TO THE REST SO I WOULD NOT GET TOO HUNG UP ON THAT.
I'm still expecting a $USDX led bounce in the equity market as well as the bond market, certain stocks are going to be shorts before others, but this gives us a chance to open or add to any positions we may want to tweak a little.
As I have tried to make clear, it doesn't look like smart money is even participating in this move, thus my own participation level is so low at present having closed VXX puts today.
In comparison to what comes next, this bounce is nearly meaningless like Monday morning's forecast."
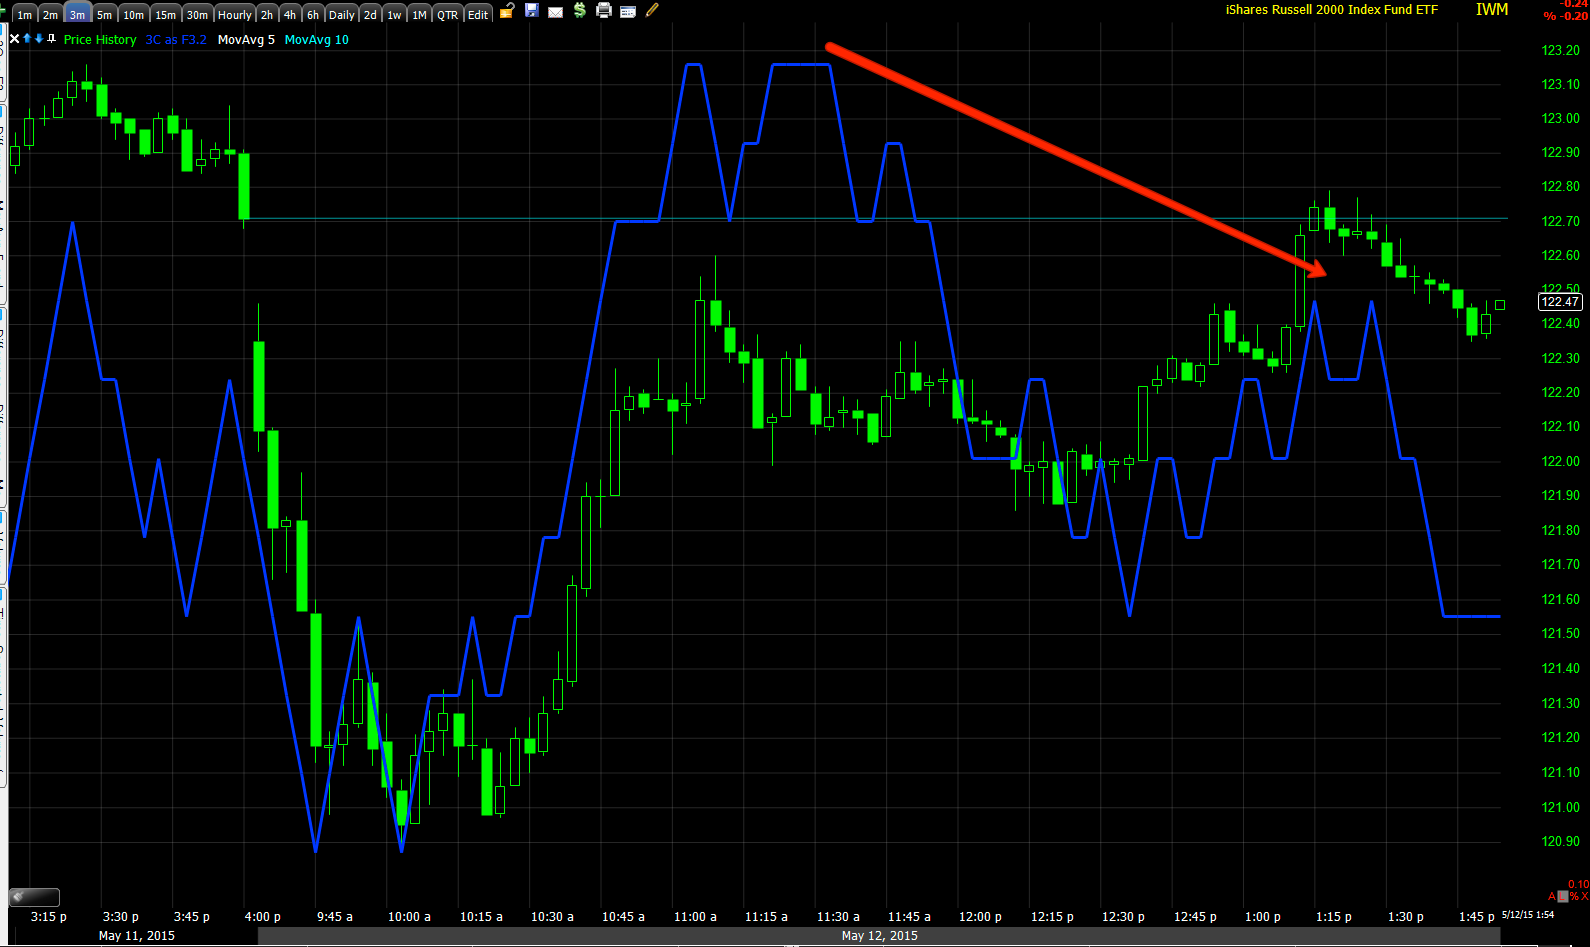
Obviously first things are first. The early week weakness seems to have been fulfilled for the most part today, more than enough reason to take the VXX (Friday) Call position gains off the table as we did this morning...
We exited the calls with a nice gain right at the red arrow before VXX started losing ground, this exit was brought on by the loss of momentum which I never want to be caught in an options trade when that happens.
The point of the chart however is this is a 3 min VXX chart (VIX trades opposite the market). While I could see no good reason to keep short term calls that expire either this Friday or next in place, we really haven't seen that much deterioration on the 3 min chart as we might expect on a market bounce where we might consider VXX puts. With a chart like this at present, I WOULD NOT CONSIDER VXX PUTS. Again this is not about probabilities, it's about high probability/low risk, well timed trades with a reasonable risk:reward ratio.
That chart alone tells me something about the market. In brief, I still expect some sort of bounce in both equities and bonds (I need to do some updated $USDX analysis). The charts for the averages are showing significant improvement along the lines of the forecast from Friday, BUT in my view they are either NOT THERE YET or EVEN IF THEY WERE READY TO MAKE A MOVE HIGHER, I WOULD NOT ENTER A TRADE WITH THE CHARTS LOOKING AS THEY DO which is to say they are incomplete. That would be a move I wouldn't trust and I like to sleep well at night.
That all being said, it's my opinion that we are in the very reversal process I mentioned first thing this morning as something that would have to occur before the market is ready so I wouldn't say there's any failure or missed opportunities, it seems to me at this point it's just the process unfolding. The main difference in market action terms is a process which is more stable vs. an event like a "V" shaped reversal that is NOT stable.
Here are a few charts showing the probabilities of a bounce and where we are in the process.
This QQQ 10 min positive divergence is one of my favorite charts for a bounce trades. As I said earlier, I favor the Q's and IWM for any long bounce trades (kind of like what we have been doing with VXX calls/puts).
However, the narrow "V" base was predictably weak and the market needs a stronger base even to pull off a bounce that is more or less in the noise "loitering" range (A concept we talked about last week and expected to see. This typically happens at important pivots, the last good example was after the failed head fake move last September right before the move to the October lows) as these are, at least if we are to get involved with them.
SPX triangle's upper resistance trendily was the area for the head fake, it wasn't the best head fake example, but since it failed price has loitered around that area the same as just after the September head fake (
Igloo and Chimney top) move and just before the move to the October lows. I suspect this is a larger loitering range as it should be a larger primary trend move
(eventually taking out the October lows).
The NDX had a better example of a head fake move/false breakout in the first yellow box to the left, it failed and then the loitering around the resistance/support area or the pivot at the top trendily. Note the daily hammer candlestick, the same is in the SPX above.
It looks a bit to me like the market wants to make a move higher here. I just wouldn't want to put money in to it at this point without some better looking charts.
The IWM 5 min also looks good, it has a better "W" base it has moved off and today's divergence looks good so far.
The SPY 10 min was close to the QQQ 10 min, it wasn't leading as much and has seen some damage since. Note again the sharp "V" bottom ,
Now intraday charts which is where most of my problems with the market right now lay...
SPY 1 min is showing an intraday negative, it looks like it wants to come down if this holds which would probably be good for straightening out these charts and getting them in shape.
The 3 min SPY chart has the same type of signal.
I simply could not go long even for a 1-day bounce with charts like this not in line with the trade.
Again though, if this is part of the process and prices come down, I would view that positively so long as the 3C charts show improvement in these timeframes.
SPY 5 min is still in line and hasn't seen the intraday negative 2 and 3 min charts above migrate this far out so this again tells me that this is likely still part of the basing process ad there are still decent chances we can pull off some short term longs and then move to the larger trade... see the quote above from last Friday's forecast for the larger/next trend after a bounce.
The NYSE TICK shows the second high of the day failing to exceed the first, much like the 2, 3 min intraday negative divergence at the second high of the day.
And my custom SPY/TICK indicator shows what looks like short term capitulation of the recent weakness and a market trying to build out a base that it can bounce from.
QQQ 3 min is in line which is a decent signal for a bounce/long, however...
The faster, more sensitive 2 min chart is showing a negative intraday divergence again suggesting a pullback in price. Again, if the 3C charts improve on an intraday pullback, I'd view that as a positive for taking a position.
IWM 5 min is more or less in line intraday which shows some repair of recent weakness.
However like the other averages, the 3 min which is more sensitive is calling for or showing a negative divergence intraday which should lead to a pullback which could be accumulated and whip these charts in to shape.
I just wouldn't trust them as they stand RIGHT NOW, even if I knew the probabilities were extremely high for a bounce, you don't want to wake up the next day with a 3% gap down on the open.
Patience...


No comments:
Post a Comment