As you probably know last year's golden child asset, bonds are this year's pariah. It was very interesting to see 3C confirmation on 60 min charts through most of 2014 until late in the year when we backed off the position that bonds should keep rising and wondered what was next as it didn't look like the support for more upside was there any longer on the long term 3C charts.
In any case, the original Trade Idea is filled with charts and the concepts that make a TLT counter trend rally or bounce very attractive,
Trade Idea: Long Bonds / TLT. Here are some additional charts and a
lot of concepts that we use with any asset in any timeframe, fractal concepts, Bond Rally / Swing and here's yesterday's most recent update,
Quick TLT Update.
This excerpt below is from yesterday's update as TLT is up nearly 2% (benefitting our original partial position), however I knew there was a risk in not filling the trade out yesterday...
"If I were filling out the second part of TLT as planned in advance with TLT long or TBT short, I'd have little issue with doing it here.
As it is though, I'd like to use the June 19 calls so I'm looking for one last thing that we see about 80% of the time before a reversal, a head fake move and in this case it would be a stop run. I may miss filling out the position, but for options, this gives you a nice discount, lower risk and the best timing we can get from price based signals."
Despite today's move up, we are still in an excellent overall position and we still have a decent probability of filling at lower levels, however even filling here should lead to a more than satisfactory gain on a counter trend rally.
This break of a long term trend line and why it often leads to a counter trend move is explained in the first post linked above . I suspect these are our two most likely upside targets so we are still below the trendily and have plenty of room,
but I don't think it's a wise idea to chase a trade, rather let it come to you.
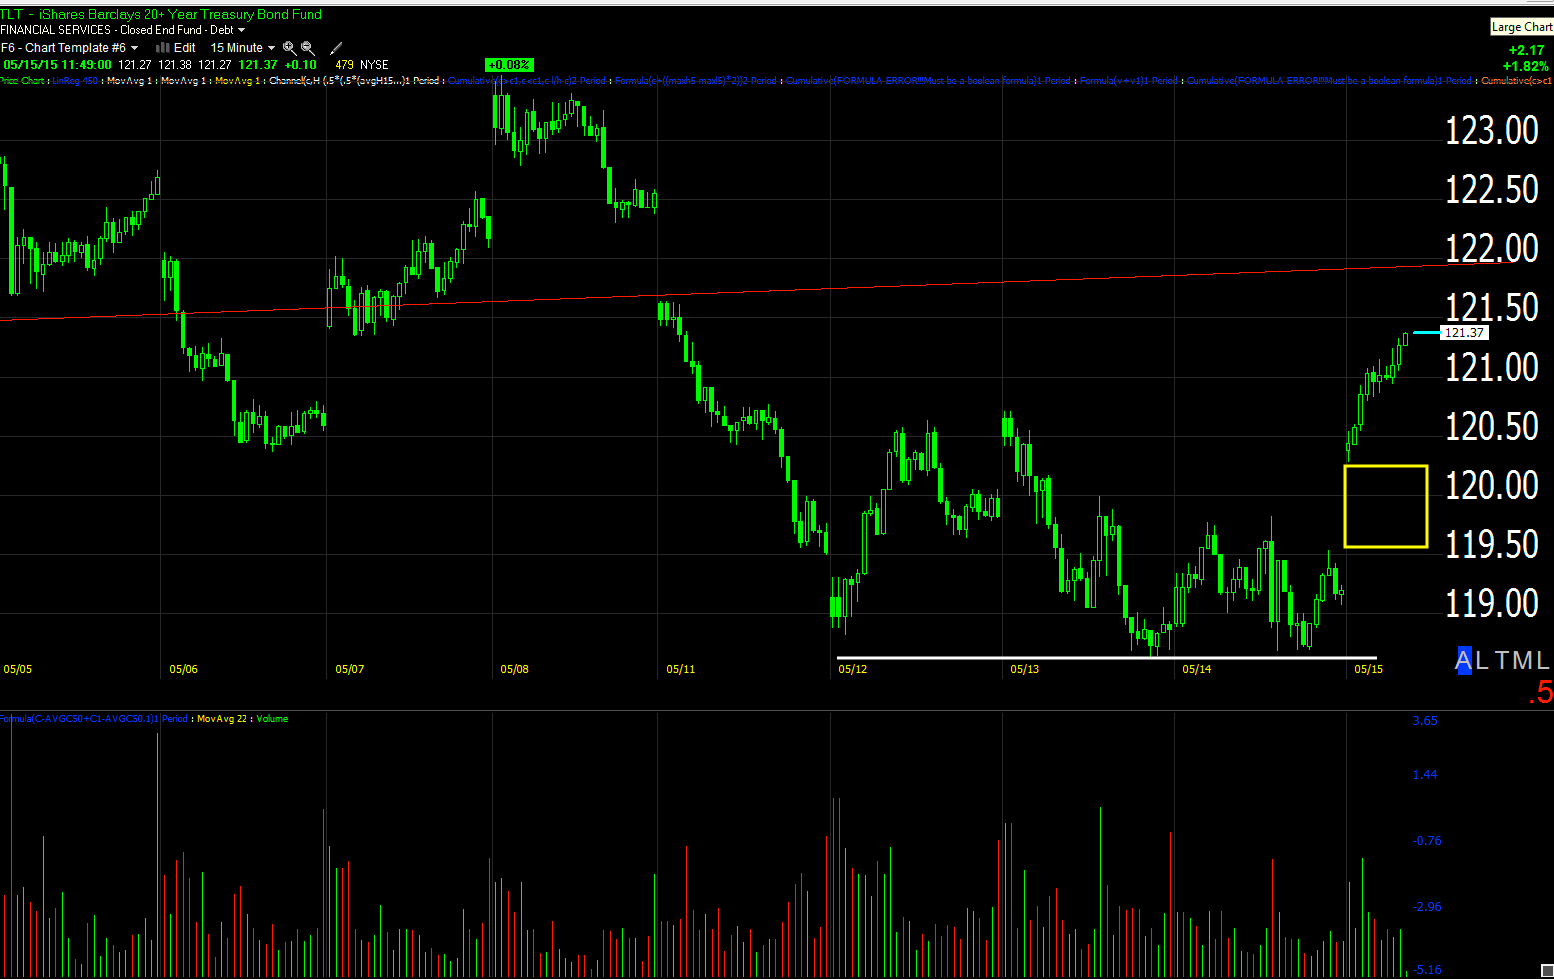
Here's a closer look at what we were looking at yesterday, the reversal process from an suspected pullback is in place. A run on stops as this trade idea seems to be getting a little more popular than I'd care for would be most appreciated and offer an excellent entry or add-to once the move is confirmed as a stop run/head fake which it almost certainly would be. In yellow we have today's gap. Over the past 5 years or so the market has been ruthless about filling gaps which I prefer it wasn't, but in this case that may be helpful.
This is the 30 min 3C chart from negative to confirmed downtrend to accumulation for an obvious counter trend rally/bounce.
The first position was entered on the 7th, but only at half size as I suspected the base was too narrow and would pullback creating a more stable base which it did so we are still at a decent area theoretically to add, although as I said, I won't chase a trade.
Tjis 3min chart shows the first entry and the next day the divergence on a gap up for the pullback that was suspected with the reversal process and positive divergence taking place confirming the "larger base" theory of the 7th.
This 5 min TLT chart shows an impressive divergence, I can't imagine this would be anything less than a counter trend rally and within a downtrend (as is the nature of a counter trend rally), these can be some of the strongest rallies you'll see as we are getting a glimpse of today at nearly +2% for TLT!
So far intraday we have good confirmation, but I'll be looking for signs of a possible pullback, it is an op-ex Friday and things may look quite different early next week. Either way I'm sure we'll fill this one out and it will be well worthwhile.


No comments:
Post a Comment