I think the market is easier to explain here through charts. Yesterday I had expected a bounce and opened a last minute IWM speculative call for fun, that call is just in the money, just barely.
In the Opening Indications, it's like a fight between the concept that "Once the market starts a cycle (no matter how small-even intraday bounce) it rarely abandons it". The market looks like it's caught between that concept and all hope for a Greece surprise is gone, which it likely is with the EuroGroup meeting ending earlier this morning with no result.
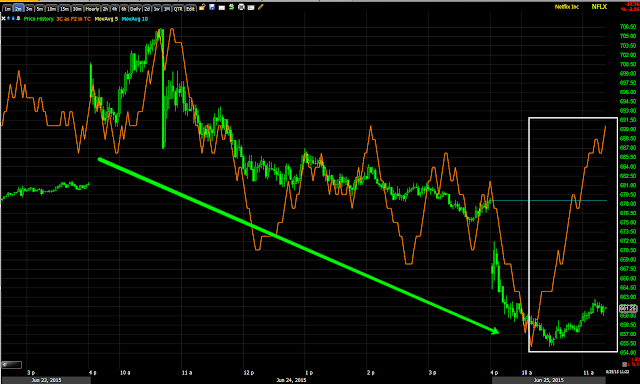
However NFLX which we opened a core short (or an add-to position) yesterday, seems to embody what the market is going through, thus looks like a good proxy for the market.
NFLX 1 min is trying or is putting in an intraday positive divergence after losing more ground this morning, however that is a very weak divergence as it's in a very narrow, tight "V".
The 2 min chart is in line since yesterday's open and through today's, but is seeing a bit of migration of that divergence from the 1 min chart. This looks like it wants to bounce intraday from here, but it's almost out of commitment to get it over with.
The 5 min chart, which is as far as I need to go as this is a proxy of the market, not a NFLX update (which hasn't improved in anyway beyond the 1-2 min charts anyway) and it looks horrible. No bounce is going to withstand divergences and distribution this strong for very long.
The market looks like it just wants to get over what it started yesterday and then continue down and as I suspect, slice through the support levels like SPX 150 day ma.
Is interest rates about to start going up?
-
Yes, I know - it does not make any sense - FED is about to cut
rates...but....real world interest rates are not always what FED wants it
to be.
6 years ago


No comments:
Post a Comment