Not much has changed in market terms or rather Greek terms except the IMF is still sending the message that no Greek deal is sustainable without a debt haircut, which is the same message they sent out 2 weeks ago, why the EU would think they have changed their mind on an even worse deal is far from my knowledge. This may cause some trouble and obviously puts Germany and the IMF on a collision course, I'm just wondering why the Washington based IMF has more interest in Greece's viability than the EU does? You'd think the bankers would be less compassionate than the politicians. In any case, no big news there except a scramble to try to put together bridge financing as an ESM program would take some time to put together (hold me over money). Remember all of this still has to be passed through various parliaments including the Greek before it's really even a discussion much less an actual deal.
As for the charts, I have a feeling they are something quite different masquerading under the pretense of news. July 2nd the market was ready to bounce and tried to on last Tuesday's head fake move, it was obvious some news leaked out that killed the bounce in its infancy and we treaded water all of last week as demonstrated yesterday until we got some headlines the market could use to pull off its bounce, but as I showed all day yesterday and at the end of the day, it was not a healthy looking bounce, especially for the first day.
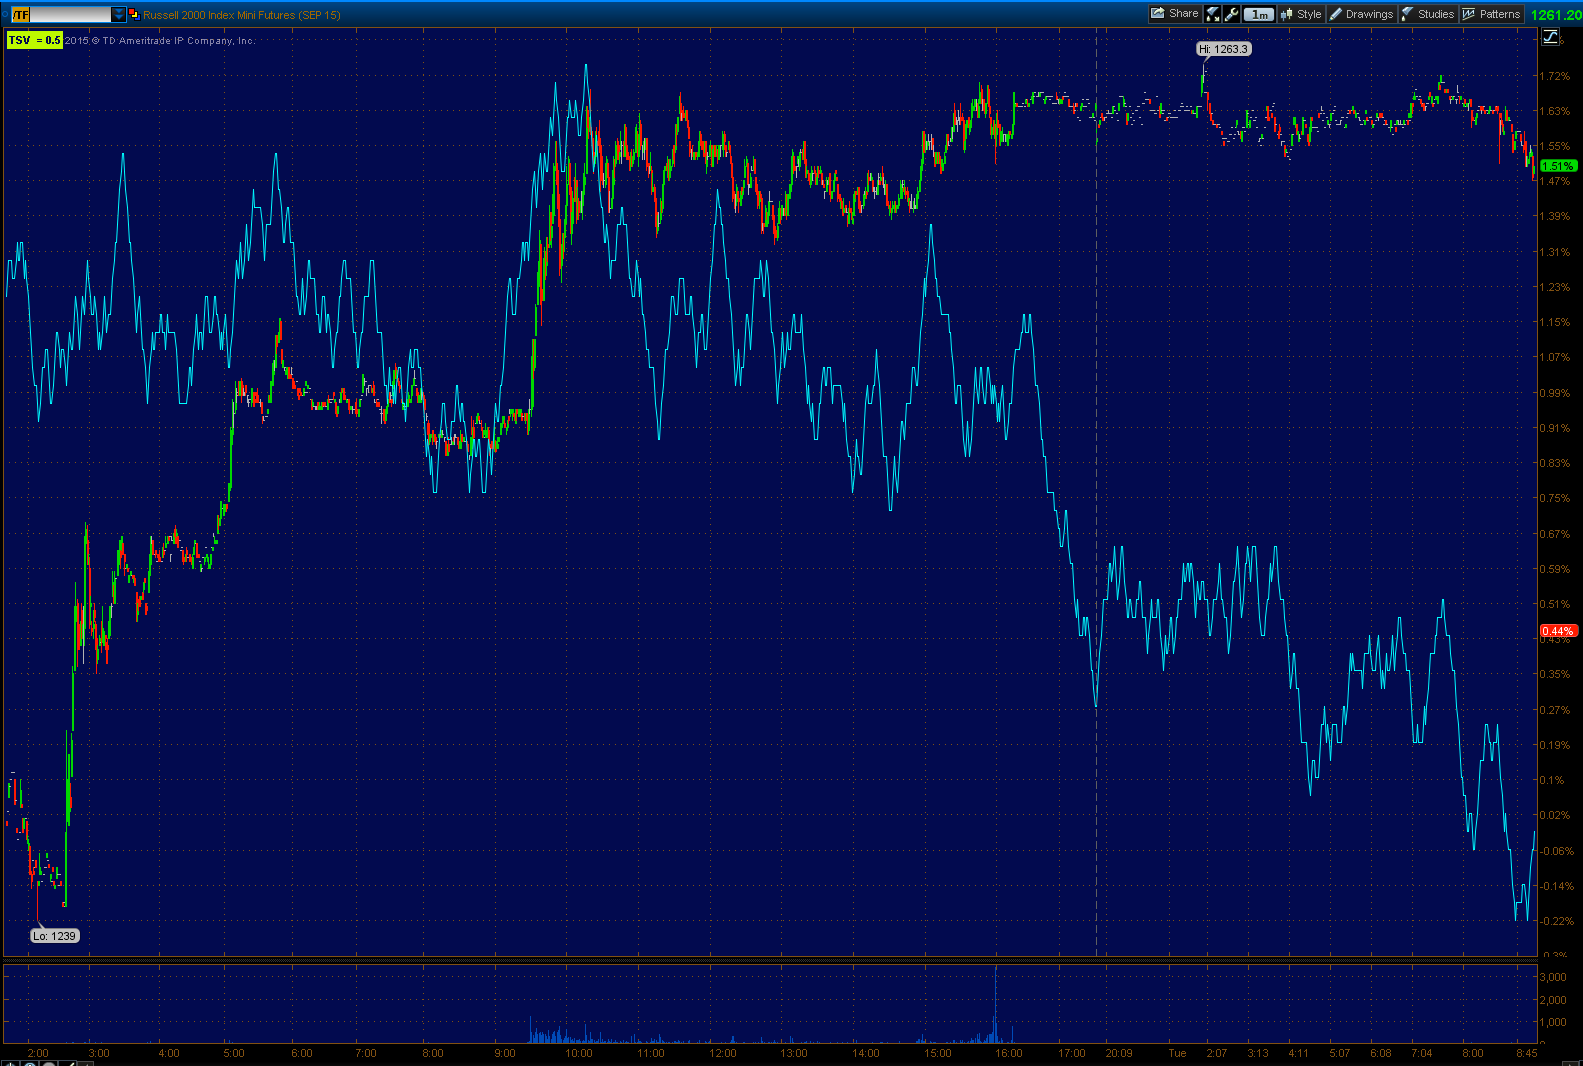
The same strange flat range that was seen after hours yesterday persisted through the entire night with the same ugly negative divergence working through longer timeframes. It's almost as if someone tried very hard to make sure the market opened today near yesterday's close perhaps to continue the bounce and break above the 50-dma, not lose ground overnight, but things don't look good.


I don't know how long it takes us to get to this 10 min chart and for the market to make a real new leg lower rather than some noise/pullback, but my initial thought was about a week or more specifically this week. We'll just have to keep tweaking that forecast as the charts develop.

And there was some downside in oil overnight on the Iran nuclear deal, but a deal means nothing, it's the implementation which will lift embargoes which means Iranian oil would take 6 to 12 months to hit the market if all went well, so this is just a little knee jerk and doesn't change my view of yesterday's USO call position.

In fact looking at Brent Crude futures, I may even consider adding to the USO position if it can demonstrate that it's showing decent accumulation, otherwise I'll just stick to yesterday's plan.
Today's plan is to see what the market is telling us because to me it looks like this bounce was meant to go further, but it also looks like it has been hammered pretty hard with distribution requiring overnight baby sitting to keep it from sliding down the drain.


No comments:
Post a Comment