Leading Indicators are looking interesting as they are clearly in line with the stage 4 trend and worse on a longer term scale or bigger picture of the market, but intraday, they look to be either putting in some support for the 2 pm post pin market action which can include a bounce or perhaps something a bit larger in to early next week. I don't want to read too much in to these signals, but it's also hard to just pass them by when you see how accurate they have been intraday as well as the TLT changes.
This is the SPX:RUT Ratio in red vs the SPX in green. At the start of the bounce's base the indicator is positive, you can see where it puts in a clear negative at stage 3 and the head fake area and more recently a relative positive in this area.
Intraday it was very negative on the open taking price down, but has since flipped to a more positive intraday tone.
Our Pro Sentiment Indicator has been ruthless to the downside and still is, however...
While I don't want to read too much in to this intraday, it is a similar signal throughout leading indicators intraday which makes me think perhaps the post pin (2 pm) action may look different than the earlier price action and perhaps lead in to early next week.
Our secondary confirmation Pro Sentiment Indicator is choppy and sloppy, but has a more positive tone intraday,
This is a reminder of the saying, "Credit leads, stocks follow" as HYG leads the SPX lower, however there has been some very light, short term positive action in HYG, I wouldn't expect pros to put any kind of real money in HYG, but they seem to be trying to dip their toes in and I see no reason other than the typical support they tend to use HYG of since it's already in a bear market.
And HYG vs SPX intraday, again note how accurate it is even on an intraday basis.
This is the HYG 1 min 3C chart.
The 2 min is positive as well as the 3 min and it has a much more lateral look than the market averages.
While there's no VIX slam, it does appear to be underperforming as of this capture as it should be seeing a higher high to the right.
And Yields as mentioned earlier through the bounce cycle leading to the upside then to the downside.
Intraday though, they too like all of the other Leading Indicators have moved sideways and slightly up.
The asset that has a direct correlation to their movement is bonds, in this case the 20+ year TLT with a 1 min negative that saw some intraday support, but overall it keeps getting worse.
This is the 5 min chart now in TLT leading to the downside a lot more and a 5 min divergence intraday is a pretty significant thing.
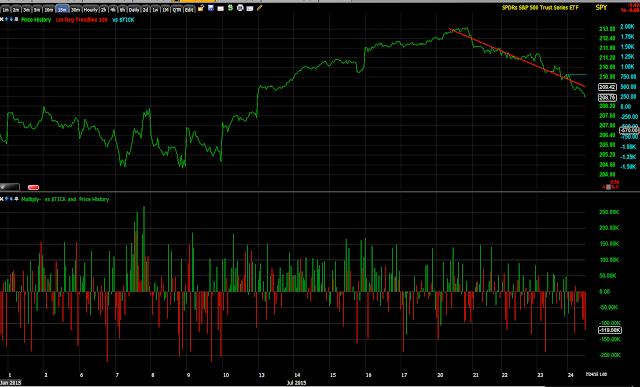
As to that bigger picture, I was showing the custom TICK and it was a bit harder earlier in the week to see the deterioration in TICK, although I could see it, I imagine most of you could. Here it's very clear.
Keep an eye on the intraday TICK around 2 p.m., I suspect we are either seeing support for post 2 pm price action or perhaps the start of a bounce finally that is a bit larger in to early next week.
I'll have a market update out soon as well.
Is interest rates about to start going up?
-
Yes, I know - it does not make any sense - FED is about to cut
rates...but....real world interest rates are not always what FED wants it
to be.
6 years ago


No comments:
Post a Comment