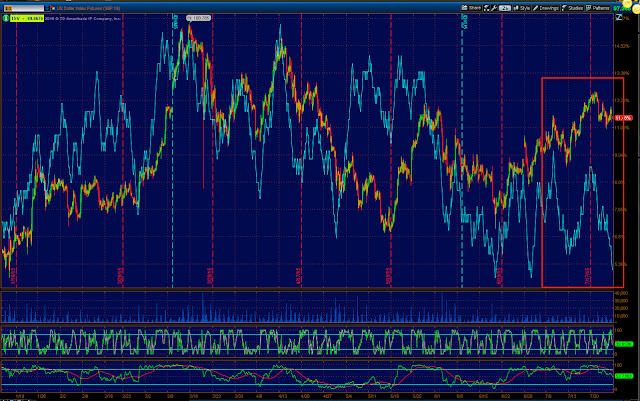
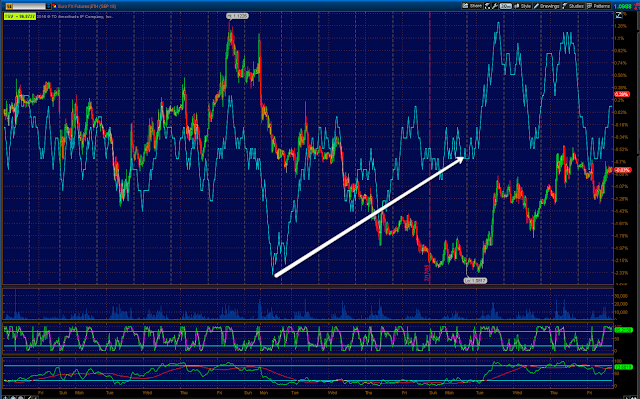
I went through the Futures charts, it seems the 30 year Treasuries are showing the same thing as TLT, which could be the leading divergence in yields will flip and support a short term bounce which I would only use to short in to , or perhaps as it was just before the July 10th bounce when the carry trade was being unwound, Treasuries too will be unwound due to liquidity concerns and Yields will stop working again as a leading Indicator.
That said, there is some very near term support for the market in assets like HYG, but nothing that would be of much more interest to me than the speculative IWM call, partial position.
The ES 1 min chart shows the overnight distribution in to higher prices as mentioned this morning and in line to reversion to the divergence as of just before the close.
TF/IWM futures which have taken it on the jaw the hardest, look more likely to try to bounce, thus the last post. However if we get more market dispersion between the averages, there's no way that can be considered bullish for anything other than the very short term period of the bounce.
The SPY 3 min chart today looks like it has been putting in some accumulation for a bounce early next week, whether it's out of the gate on Monday or needs to do a little more work, I can't say, it may just fail as several divergences this week have been run over, but not 1 was strong enough to make it to the 5 min charts.
The IWM 3 min looks even better to me and I could see a quick lightening bolt shaped bounce, but I don't expect anything to hold. As I have said several times this week, it would be absolutely normal behavior even during a full blown bear market.
As for the longer term probabilities, this ES 10 min chart should be VERY clear as to which way probabilities lay.
This Es 30 min chart of the bounce should be even more clear. No 1 or 3 min charts are going to change the path this juggernaut is heading toward, at most they'd be like waves crashing off its bow.
If you need more, the NDX futures 2 hour chart leading negative at a new leading low.
And the Dow 2 hour futures, this isn't a recent trend and that's why we knew the bounce would fail before it even started.
As for 30 year futures, this 10 min chart is a reflection of the TLT charts seen. This may mean the Yields leading indicator stops working again. I need to do about an hour's worth of analysis here, but Treasury market liquidity is very thin and a lot of traders are getting very nervous.
However beyond that at the $USD 60 min chart, the highest probability is down which makes a rate hike more likely and market downside as well as a lot of commodities.
The $USD 2 hour looks as we have expected, the $USD is in a primary downtrend, the F_E_D needs it to be- or at least it will continue the trend started.
As for the 15 min Euro it looks as we said earlier this week, consolidating for more gains, not good for the market.
The Euro futures 30 min shows the same.
As does the Yen futures 10 min, right at the exact area I guessed it would consolidate in to accumulation.
And the Yen 30 min. This would facilitate the carry unwind not just in the FX pairs, but all assets financed with carry proceeds, bonds, equities, etc.
As for VXX, the 2 min chart has a VERY slight negative.
The 10 min chart leading positive in a big way. UVXY longs and VXX should do very well as the market moves the opposite direction.
And VIX 30 min futures showing the same.
As well as VIX 2 hour futures.
Gold has bounced here off a weak base, but I'll let the open GLD calls work until it looks like they won't anymore. We still have a mystery in the gold slam downs, I suspect it's part of longer term basing, but we'll know more next week.
Other than that, this is what I expect to see in the market within the next week or so...
Stage 4 of the bounce concludes slicing through the 200-day moving averages, once that happens, the entire tone of the market changes and things move much more quickly and more volatile.
Have a great weekend, I hope you had a good opportunity through this bounce to get some decent short positions in place for longer term trend trades.


No comments:
Post a Comment