Sunday, August 22, 2010

Being Realistic, Being Honest

One of the hardest and usually most foolish things you can do in Analysis of the market is to announce your opinions. People are looking for a guru, always, there isn't one. Even Warren Buffet has had some pretty hard years, which means we can't be right all of the time; this is why we have risk management.

There is a very real human proclivity towards defending one's stance taken, the market is too dynamic to allow anyone to take a stance and be right about it every time. When we announce our stance, we put ourselves in the unenviable position of either being honest with yourself and others and saying "I was wrong" or as human proclivity usually dictates, to stand there in defiance of the market and continue to defend a stance that you know to be flawed. It all comes down to that simple saying that seems puzzling at times, except times like this, "Do you want to be right or do you want to make money?"

So how do I personally handle it? I have an obligation to my members to be honest with myself and with you. You have an obligation to be honest with yourself, you'll find if you are, you probably won't have those huge 50% declines in certain positions that many of us have experienced at some point. This is why I say trading is a very spiritual endeavor, if you do not uncover yourself honestly and transparently, chances are you won't make it very far in the market. This IS NOT a one time ordeal, it's never ending, just as you are a never ending student of the market, you must also be a never ending student of yourself, your flaws, weakness, strength, limitations and when appropriate, you address them until the next layer is peeled away. The market can teach you more about yourself then just about anything or anyone.

Being we aren't fortune tellers, we take the evidence we have at hand, we look for the strongest probabilities-objectively- and we decide whether to jump in or wait it out-that's your key advantage over Wall Street-you can wait it out, they can not.

So, we are onto next week. Take a look at this chart, each box shows a candlestick reversal of some kind, either a Doji, Star, Hammer, Hanging man, etc.

We have seven on this chart alone that successfully called a short term reversal and two in yellow boxes that did not. Those are decent probabilities. The SPY here, put in a Doji Friday, the SP-500 (the Index that the SPY tracks) put in a hammer, both are interpreted in their positions as upside reversal signals. Last week I showed you the strange behavior the market exhibited in daily accumulation and distribution, rather then the typical type which occurs at swings, rather then on a daily basis. I think it had to do with the Iran/Israel situation that seems to have passed for now; Smart Money didn't want to be holding any big positions with such a wild-card out there. Now that they've collected the August Call premiums, they are free to finally let the market bounce, something I've been looking for the last week. We have the Friday accumulation I showed you and the reversal signal in the SPY, QQQQ, DIA and IWM.

I warned that this bounce "could" be pretty nasty, a sharp move to the upside. The market is like Judo in a way, it uses it's opponent's momentum against their opponent to minimize the need to lay out cash to turn the market. This is the point of false breakouts, temporarily failed price patterns and more. For example, assume the market made a new high, most shorts would be squeezed out of their positions, buyers would enter the market in droves and then it takes one simple day to reverse that breakout and put all of that new money at a loss, that in itself creates downward momentum as the longs continue to sell, the market continues to drop forcing more longs to sell and the shorts to re-enter the market-and just like that, they've used dumb money's money against them to create the sell-off that they shorted into on the breakout day and sometimes before as the market rises and shorts cover.

This is my first instinct, not a new high, but something scary enough to create that tidal wave of human emotion-Fear and Greed, the movers of the market.

So, we can look at the longs that are on limit orders on the current list and set alerts for when they trigger and ride along the bounce for a bit (if that is indeed what we get, and thus far our only evidence seems to point to that) or we can sit it out, wait for a nice move higher and when we see distribution, start selling and adding to shorts at much better pricing.

Here's the accumulation I see in the SPY...

You can see at the red arrows distribution and the market sell-off, the white arrow is accumulation on Friday-which was pretty much the last day the Israelis could hit the new reactor before it was fueled. The white box is a leading divergence-which is powerful accumulation and THIS is the normal accumulation I see before a swing up, unlike what we saw last week. In addition, the accumulation has made it all the way to a 15 minute chart, which is significant, but not past it. This implies we will see a move up that will last at least a few days, we have to see how they react to the move up, do they start selling or not? I think $110 is an attainable target on the SPY, $112 is not out of the question. For this to be an effective and meaningful bounce that does what I described above, it will have to be convincing, that means a big move, possibly higher volume, and probably closes near the highs of the day. I am largely short and this does not phase me, it actually is something I've been anticipating and hoping for. If what I see is correct, it will just make the downside break that much more violent when that time comes which I believe is not far off.

I've written here and at Trade-Guild quite a bit about stops, I'd recommend reading them. You must absolutely apply any stop strategy within the confines of your risk management plan. If you have not read the risk management article that is linked at the top of this site under "Get The Most Out Of Your Experience" and not understood and implemented some version of it, you re doing yourself a HUGE disservice-This is the KEY to your success.

Any short trades with a good profit in them you may want to consider taking some of those profits, the reason being, if I'm correct about this, you'll be able to get in again at good or better prices and make the money a second time. I personally will hold my core short positions that are meant for the long term as there are only a couple of days in a downtrend that contribute to the move down, we can usually time them pretty well, but not perfect and I don't want to miss that one day that takes the market down 3%-individual stocks usually twice that and the leveraged positions 2-3x that.

So tonight I'm running the scans, looking for anything that jumps out, long or short. Short trades will probably have limit orders attached to them-don't forget to watch the member's only video about our entry system called "SWING 1", some trades may have that designation.

So, check the list later tonight. For new members if it says "market" it will be in the notes section and means I like the trade at market open, at market price. Longs are still to be considered counter trend so I would keep that in mind when formulating your risk management plans.

LIMIT< means to go short, intraday (unless it says on the close) when the securities price drops below the given limit price. LIMIT> means to enter the trade when prices passes above the limit price. The SWING 1 Entry is explained in detail in the video linked at the top right of the site.

If you have individual questions, please email me. I'll be putting any trades I find on the July/August Trades list, the newest ones will be found at the bottom of the spread sheet.

One last note, as I have told you so many times, what is obvious to everyone is obvious to Smart Money and they will use that against you. There's a very obvious H&S top, ultimately I believe very strongly we will be setting new bear market lows, but Smart Money could very well try to create a false breakout to make the pattern appear as if it has failed, that is the nuclear option, I don't know that they need to do that to accomplish their aims, but it is within the realm of possibilities.

Don't forget to set your alerts, www.FreeStockCharts.com is the best FREE, real time trading platform I've seen that will allow you to do that. I personally use TeleChart for all of my analysis during the trading day and StockFinder at night and occasionally during the day for specific indicators.

Have a great trading week

Placement of Stops

As you know it's difficult for me to update every stock on the list, and even remove them once a stop has been hit, so sometimes the returns, especially losing ones are not representative of the actual trade. However, one trade I'd like to show you that recently has made a lot of money for several subscribers that took it on was KIRK from 7/26 on the recent list. Trade Guild has a post up from last night you should take a look at. You should always read Trade Guild in addition to WOWS, there will be articles there and of course the "Resources and Concepts" section that you will find many interesting past and future articles. The post this weekend shows how effective 3C is compared to other great and well known indicators designed for the same purpose. It also shows you that the major crashes of the last century didn't just happen, there was warning.

It ends with the Kirk Trade and 3C's negative divergence showing why the trade made for a good trade as Smart Money exited-the position is now down (a gain for members) approximately 30+% in less then a month in a market that has otherwise been pretty lateral and not really that easy to generate those kinds of gains.... YET-that will change soon.

The point here though is the stop I listed. Stops are usually best exercised just before the end of day (EOD) , if you were to stop out on intraday volatility it would be very difficult to hold any position very long, even if you were right. The last hour is when the pros trade, especially the last 5-10 minutes, so that's when we usually want to stop out unless there's just a huge sell-off and then common sense and self preservation kick in, but you can always email me first to see what's really happening.

Back to my point, the stops I provide are my estimates, I encourage you to adjust them according to your trading style. This particular stop came within 1 penny of being stopped out, I don't know if I should say it was a great choice or a poor choice, but tops like we are in are volatile. I do NOT want to see you move your stops once you are in a position unless you are locking in profits, but this means that before you enter a trade, you must consider the extreme lateral volatility of a top, many great trades that we are 100% correct on, can be stopped out because we put a stop too close. I encourage you to use wider initial stops, according to our risk management, you take on fewer shares, that can all be rearranged once the trade moves in our favor.

You will notice many stops I list seem almost arbitrary, there's a reason. Instead of a stop on a short of $18, I may put down $18.13, this is because the human mind is attracted to whole numbers. Therefore stops tend to congregate at whole numbers and that increases the likelihood of a false move by a market maker or specialist to trigger those stops,because they are the middle men and are the other side of a market trade, the last resort by law. Besides trading their own account in the stock they make a market in (which can represent 30% of that stock's daily volume), they also fill institutional orders and they make a lot of their money on the spread, the difference between the bid and the ask. You've seen it before, the last sale maybe at $10, the bid is $9.97 and the ask is $10.02. The market maker, being the other side of the trade of last resort, will pay you 9.97 if you want to sell at market, and if you want to buy, the market maker will charge you $10.02, the difference of $.05 per share if the market maker's profit. The more volume they can create, the more $.05 transactions they can rack up. An easy way to create that volume is by false breakout/breakdown. This is where they know where they stops are congregated, usually at a whole number but if you put in an order with your broker, chances are they can see your order along with everyone else who has put in an order for a stop or a purchase. Many books teach Technical Analysis tell you this is the second thing you should do after you enter a trade, it is wrong! You are showing your cards to the person who wants to take your shares. I always keep stops and orders in my head and only place the order when I'm ready to have it filled. These market makers can usually move the markets a bit to trigger these stops and a nice payday, you will commonly see it as volume jumps near whole numbers, obvious patterns and obvious support or resistance along with popular moving averages like the 50/200 bar moving averages. THIS IS WHY, I place a stop a little further away at an arbitrary looking number like $10.11 instead of $10 where human psychology kicks in as our minds gravitate to these types of whole numbers. It's the same reason that retailers use a number like $99.99 rather then $100. It's only a penny difference, but in our minds, there's a big difference and retailers have known it for years.

So keep your stops initially a little wide, try to avoid placing them with your broker until you are ready to execute them. Do not put them next to anything obvious. This is one of the things about technical analysis I talk about that was meant to help, but has become a trap, such as putting a stop at a 50 day moving average, smart money knows traders are all looking at the same level and they will shoot for that level to knock all these traders out of their positions, get shares cheaper and create a good income flow for the day as you multiply the spread by the volume surge created by those stops being hit. You should also consider all of this BEFORE you enter the trade and make sure it's a part of your risk management planning (see the link at the top right of the site on risk management).

It's ok to use a tight stop, if that is your plan. Many professional traders will do exactly that, but the difference is they may enter the trade 4-5 times before they get the position they want, amateurs tend to walk away from a failed trade. If you use a tight stop, make sure it keeps the losses very small, then you can afford to enter the trade multiple times until you get the positioning you were after.

Here's an example of what I'm talking about....

Click the chart to enlarge. The first red box shows a surge in volume as traders commonly place stops at or just below the 200 day moving average in blue. Technical analysis books have many times claimed that a move above or below the 200 day moving average is a buy or sell/sell short signal, thus traders have stuck with this antiquated idea. The first day the Specialist (same as a market maker for the most part, just operates on the NYSE rather then the NASDAQ) took prices just below the blue 200 day moving average and triggered stops and limit orders, then closed MCD above that level, putting shorts at a loss and taking positions from longs who were stopped out. The increase in volume meant a good pay day as you multiply the stocks spread by the number of shares traded that day, it was a good move for the specialist and didn't require them to take the stock too far down, just enough to trigger the stops, which they can see in their order book. The stock moved up the next two days as did the broader market, traders probably figured the stops had already been hit and again put stops/limit orders below the 200 day moving average, again, they we taken out a second time on another volume spike. After that the stops has been cleared, that's why there's no subsequent rise in volume the next few days below the average. The next play was the third candle in red, this day they took out the lows that had been previously established, a common place to put to stops and the specialist took out the $60 level, an important whole number where stops were surely congregated.

Here we still have the 200 day moving average in blue, but I've added the SPY in red so you can see that the first day stops were hit, the market was moving up/closing up. MCD moved up the next two days with the market, many traders most likely believed that MCD would follow the market as many stocks do, which led them to place stops a second time under the 200 day moving average (in the red box) which again were taken out and the stock closed higher. This gives the specialist a chance to take the shares cheaply and sell some into higher prices that day, others they can hand onto for the move down. As I illustrated at Trade-Guild last night, these moves are planned in advance.


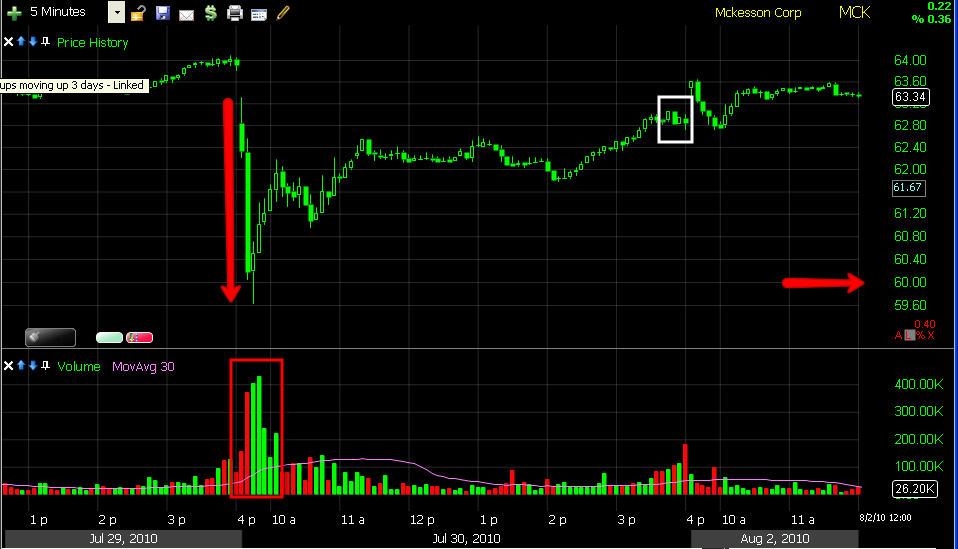
This is the run on stops you can see on the first chart, it is the last or third box highlighted in red. First lows were set previously, many stops will be at those lows, secondly $60 is a whole number that many stops will congregate at. This is what I call a "Crazy Ivan", when all stops are taken out and all limit orders of any volume and consequence are taken out. You can see the huge volume on this 5 minute chart of July 30th. You can see how quickly all the stops were hit and the spike in volume it caused (remember-part of a market makers/specialists income is the spread multiplied by the volume, the more volume, the more money they make). If they believe they can hit a large cluster of these stops, they will try to do that as can be seen here, the stock closed higher for the day (seen in the white box).  There were nearly 2 weeks in which the specialist had an opportunity to sell positions they accumulated this day at $60, they could also hold what was left as the process of distribution and the stock moving lower takes some time, anything they sold short, would not be at a profit.

I will continue to point out examples like this as they occur, it's important for you to understand how their manipulation in the markets will effect or not effect your positions. Many of the traders who had short sale orders triggered that day saw higher prices in the weeks to follow and many would have been squeezed out of their positions.

Just keep in mind these rules, if the stop level is obvious to you, it's obvious to everyone. Stay away from obvious levels, including support and resistance areas, moving averages, trading range breakout areas, former lows that may be perceived as support, and especially whole numbers. As I see them, I will document them for you, each one will give you new insight into how the market really works.

If you haven't seen this video already, listen to Cramer's own words. This is a smart man, I just have questions about his allegiances as I have had experiences like the week I called the end of the 5+ year uptrend in oil using 3C, the same week he was telling viewers to buy oil. He is very well connected to Wall Street and is a GS alumni. I believe that he has information or had information that is far superior to what he calls out every night. The distribution in oil didn't happen overnight, it was a process and I am simply questioning the fact that he has the connections on Wall Street to understand more about the situation then perhaps he lets on? Remember what CNBC is, a media outlet. What is their primary goal? To make money. Is it possible that the reality of business may at times conflict with the viewers best interests?  I've heard Cramer bash shorts up and down before, obviously it is a tactic he employed when he ran his fund, it's not necessarily the best way though to gain corporate advertisers and sponsors by saying you should short their companies, I doubt very much they'd be very keen on the idea of doing business with CNBC in the future. I'd really like to see the Mad Money disclaimer that flashes across the screen in very small words, if anyone has a screen capture of it please send it to me.

Here's the Video

Friday, August 20, 2010

Weekly Wrap

I'll be positing a lot more this weekend, here's a basic video that explains a lot, especially my last post of the day. I remember the days of watching the market and depending on indicators like MACD ti try to determine reversal points. 3C is a real leap forward, we can see what is happening as it happens and before the turn in the market, even better, we not only see smart money, but we can start to better understand the behavior of Wall Street, this is a huge advantage. So many people are stuck in the past, following the thousands of technical analysis books that have each laid their claim to fame with some new indicator or set up. I've back tested so many of these in StockFinder only to find out that they rarely even give you the same return as the market, many actually under perform, but before back testing, any author could easily cherry pick a few examples and base a system on it that a generation of traders follow blindly.

This week we saw something very new in 3C, we saw risk aversion from smart money and the reasons seem to be clear as you will see in the video. We are on the right track, we are a step ahead of the crowd as I read the message boards, so many are blind to things that are right there in front of them-human bias is a hard thing to overcome. Understanding in advance that there will be a bounce, that it is likely to be brutally scary, but that in the end, it's just a bounce, gives us confidence and allows us to make trades that our logic would never consider.

I believe what we are doing here, for those who can stick with the risk management and overcome the fear that the market intentionally instills in us, is ground breaking. I look at the typical trader, someone I advise with a lot of money in the market, and count how many times the account would have suffered devastating losses if it were not for my ability to show him proof that what he was about to do would be a huge mistake, and I am reminded of how Wall Street prays on our emotions, of how manipulated Wall Street really is and how they have a number of plays that they run over and over again, you can almost catch the routine.

This week was enlightening, it adds more to the experience bin and leads to a better understanding. When the market started moving up today, I'm sure there were a lot of people trying to buy calls that would expire worthless. I see the huge open interest in the SPY calls at $110-$112 and we now know who the seller was and who took it on the chin, it wasn't smart money's loss. Again, they pinned the market below the strike price and collected a lot of premiums.

I'm getting some great feedback and comments and I think this group is growing together, myself included. Your questions lead to new discoveries. Your insights are confirmed in analysis and ultimately your participation adds value to what we are doing.

I hope you enjoy the video and have a great weekend. It looks like we may really get that bounce after all, but it's just the cherry on top. The daily accumulation of positions is helping I believe, to set you up for an unprecedented opportunity as this market moves against every human instinct and emotion, it will just mean more gains for us.

Have a great weekend and check back for updates.

Click on the video for a bigger picture.


Last Update for the Trading Day

 There accumulation remains, the pattern is out of context with the rest of the week, but as I said, I think that had to do with fear Israel would hit the new reactor in Iran, that window is just about gone now, so maybe we are back to the usual accumulation patterns, in which case, it would suggest a possible bounce next week after  letting the SPY $110 calls expire worthless today.

So make your plans accordingly and as you see fit.

I was just wondering

If that inverse H&S was a bit too obvious on the charts, remember what I have said about technical analysis being used against technicians. The retail T.A. crowd went for the bait, the volume confirmed that, and a break at 2:20 back below $107.50 saw some volume so some stops were hit-another lesson, don't place stops with your broker if at all possible, it's like showing your cards in a poker game before you bet. In any case, there's been a few shakeouts already, and false moves lead to fast moves in the opposite direction-in this case meaning down. Although we also have to view resistance as a zone, not an exact number, it's all connected to emotions and emotions don't care about a few pennies. So now we are on the watch also for a breakdown.In that case, you want to probably consider having a reasonable short position in place, you have plenty of room and time to build it, but remember, it's only a few days in a downtrend that contribute to the major losses, most other days are up or lateral and you don't want to miss that one day that is a serious break to the downside.

Right now, overall, we still have that positive 5 min divergence in place, so with what we know, I think the assumption has to be there's accumulation in the area. If in fact smart money is not the owner of the calls, then they'd want them to expire worthless which at this point it seems as if they will with 30 minutes left, which brings us back to accumulation today. The obvious answer is they wait for the calls to expire worthless and then we get our bounce next week, early on. That's just a theory but pretty plausible considering what we are seeing thus far. So if you go short, you may want to leave some room in the position in case we get higher prices next week.

And There it is

Resistance at $107.50

The two long upper wicks of the candles in the orange box effectively can be considered probes of resistance, they have established the neckline of the pattern at $107.50. Be on watch fro a breakout above that level, I would not be in a hurry to take action as it should comes close to yesterday's highs. Do watch for any signs of trade programs kicking in, they will have a fairly vertical ascent with few if any pullbacks and you should see them in all of the major indices.  If we see this behavior, you can probably count on a move above yesterday's highs, whether they reach the $110 level? I don't know The big open interest is still at $110-$112 on the SPY August Calls.

DBO

As you might expect, as the dollar typically moves inversely to oil, a falling dollar is bullish for oil prices. Just look back to the Bush administration's "weak dollar policy" and recall what it did for oil.

DBO seems to be faring well too

Afternoon Update

I showed you the UUP chart with distribution, hinting we'd see accumulation in the market as they tend to trade inversely. Now we have solid accumulation into an inverted H&S bottom pattern, the target seems to be yesterday's highs. The exact trendline to the right is a bit hard to determine, but you should see an increase in volume when it is broken or if it is broken to the upside. The price pattern alone is bullish, remember we are talking about an intraday basis here.

There's a lot happening

3C is going in a lot of different direction, I believe this is due to fast transaction occurring, perhaps algo-traders are now heavily active. Algorithmic traders, specifically "Sharks", use a system to look for "Iceberg" orders in what they call a "dark pool" which is where orders are anonymous and usually hidden from view, in a manner similar to how 3C is used to look for accumulation patterns. However, instead what they do is send small orders or pings, and when those orders are filled, they know that there is an "Iceberg" order or suspect there is a "Iceberg" order, which is a much larger order being filled a little at  time. This is one of many algo trading strategies, but bases on what I'm seeing, it appears as if something is happening out of the ordinary.

The best tell on the market right now is UUP in a 5-min negative divergence
The SPY is now moving up off lows where volume was quite low, this is a typical accumulation area. $107.40 is an area on the SPY we want to keep an eye on. As I told you in the video and for over a week now, the trading strategies have been "a day at a time" which is strange behavior for me, but the market's are ever changing and the systems out there are ever changing. This is why it is often good to step back and take a look at the bigger picture. UUP on a 1-min chart does not show the same level of distribution, so stepping back a little gives us a clearer picture.

Remember, we are in a bad, bear market. Long trades are counter trend and I can think of few at this point that I would enter, at this point!. Strength is often a great way to enter your shorts, so I'd take a look at the trades I've provided, hopefully you set some alerts.

I will continue to update as things develop.