Friday, September 17, 2010

Another Head Fake

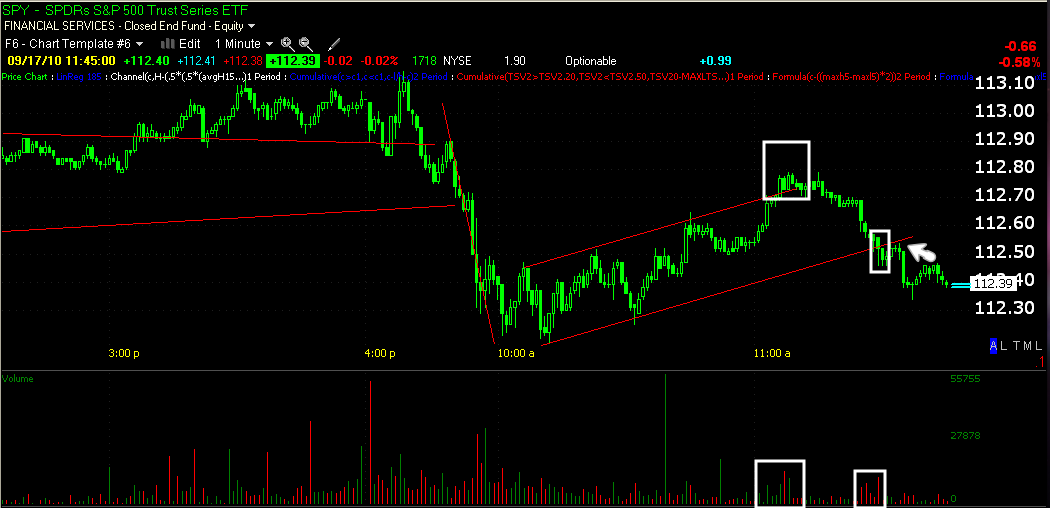
There's a triangle on the SPY chart from 11 a.m. to present, it just broke to the downside as conventional TA would suggest, we know what happens though so be on the look out for an upside head fake.

Close

A daily close around this level or below should be the start of a move down. The further into the gap the better and the higher the volume the better, we want to see panic selling.

Click on the chart if you can't see the red trendline.

3C update

The 1 min isn't worth posting, besides a minor divergence at 12:30, it's been tracking price all day. The 5 min though does have a little more insight.

This indicates a leading downside divergence. The longer timeframes are negative as well in different degrees.

3C Hourly

This is one of the broadest measures of institutional activity in the SPY

Here's where the 3C hourly stated out with the hour from yesterday to 9:45 this am.


Here's where it stands now, note the scale has not been changed
Not only is there a negative divergence at the top of the SPY's range, but the leading divergence is worse in a matter of a few hours. This hourly timeframe does not move easily or arbitrarily.

Analysis

Yesterday's closing price rally seems to have been due to a series of “market on close” orders pushing the market up.

As I showed you last night, despite the advance, we had more declining stocks then advancing.

Also yesterday the American Association of Individual Investors released a number of 51% bullish investors, an unusually high number and one in which I think we more or less expected to be toward the final stages of the advance from September. In the market good is bad, bad is good, this seemingly good report for bulls is no different then the high % of shorts in the market late August that set up the institutionally initiated bounce-imbalances are always taken advantage of.

Copper is leading the market, copper has long been associated with increased economic activity, but is it real or a speculative bubble.

These two charts would probably be of little comfort to market bulls.

You can see cause and effect of multiple negative divergences at the red arrows, currently we are facing a serious one in FCX
The hourly chart tracking accumulation for a leg higher at the white arrow and currently apparent distribution of that accumulated stock into higher prices, being where 3C stands on the daily, this is not good for copper, thus the bullish relationship it's price advance has implied.

NEXT SUPORT

$113.35
$112 area-

If price makes it down here, volume will be exceptionally important, especially at the $112 support area.

SPY FLAG 2-Lesson Complete

As I said in my last post, 75% of these patterns will have their stops run. I'm being conservative in saying 75%, if I were to say what I really think, it would probably be closer to 95% and still the retail traders DO NOT LEARN. You want to know why? Because they figure if it's in a book, it's got to be the truth and they never stop to think and look for themselves. In this changing market only those who dare to think outside the box will survive.

Above, a few points, the bear flag broke out to the upside, volume will confirm that for you., then it continued down as expected, again volume will confirm that for you. To be sure you drew the trendlines, correctly, watch volume at break out points and at the arrow there was a brief retest of resistance confirming the trendline's proper placement.

Bear Flag-game time?

I hope you can see this a/\.m.'s bearflag. As traditional T.A. takes it, a decline of the magnitude we saw this am, needs to correct, thus the flag, the flag pole is the decline (it looks like an upside down flag-pole and flag). This is conventional T.A.'s century long understanding of the pattern, so most bulls are not happy to see it, we know that the failure rate for technical patterns, at least temporarily is probably higher then 75%, so a false breakout to the upside to run stops is highly likely. If we don't see that, it would be a very bearish development as Wall Street will have shifted their tactics to confirm bull's fears. However, I wouldn't read too much into a false b/o as it's really a market maker thing to make extra money.

It's too early to use short 3C with that straight fall down and now a consolidation, it needs to compare relative points so far back and with a straight decline down, it's hard to do that.

The SPY

As noted last night, the triangle in the SPY with the start of a breakout drew in pretty heavy volume on the SPY in afterhours last night, really there seems to be no catalyst for the move down, this mornings report just basically took the fear of deflation off the table, it wasn't high enough to cause inflation concerns, so it certainly wasn't behind this move, so I leave the reasoning up to you.

The white arrow is our new resistance area. You can see the volume pickup as the bullish triangle is broken-again something we see multiple times a day, conventional technical analysis fail the user.

Rise In the Dollar?

5 min 3C
15 min 3C
60 min 30C

We've been seeing daily 1-5 min accumulation in the dollar, now we have some substantially longer timeframes that are in leading upside divergences.

A strengthening dollar will likely halt anymore BOJ interventions for the time, this should have a negative impact on Gold, oil and the market as well as other commodities. I've seen this as a pullback in the dollar with an uptrend to resume, who long this time? I don't know if it's as long as the December 2009 rally but there should be a month or two of higher prices ahed I would think.