Wednesday, January 5, 2011

PIIGS are back with contagion

Today Portugal, the "G" in PIIGS issued a 6 month bond, the yield paid to sell this piece of junk went up from 2.045% to 3.686% That's nearly double the last auction! This means the cost of borrowing once again is in the center of european contagion fears and fears of default, the higher yield will do nothing to allay those concerns.

We seem to have a cycle of fear over Europe, then it forgotten about for a month and then it's back, it's not going away and for a simple reason, there's a big problem there and while the ECB is kicking the can down the road creating those moments of peace in Europe, once again we have walked far enough to arrive at the can again.

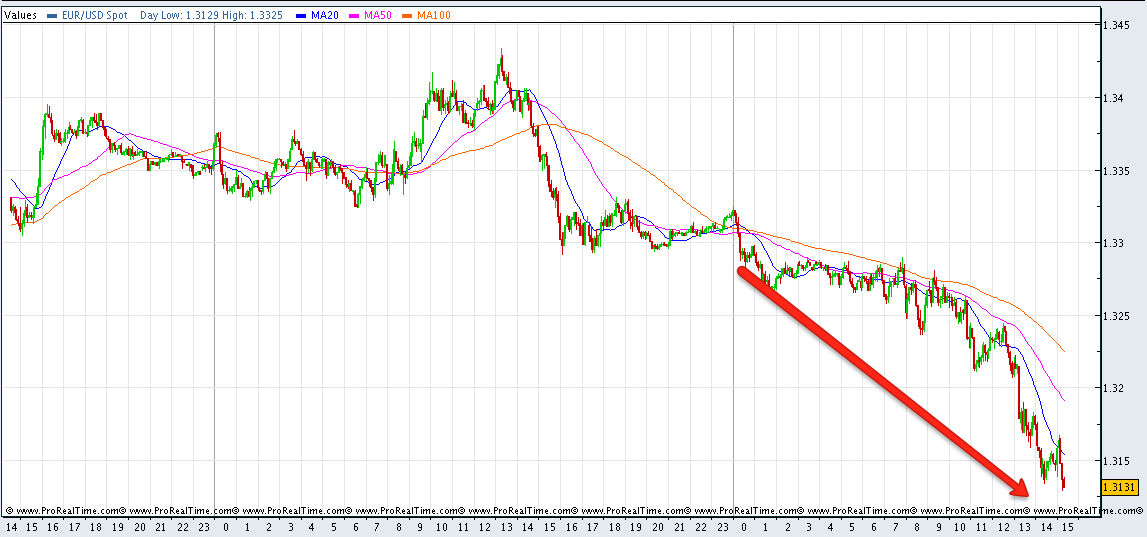
Here's the Euro's Reaction
 5 minute chart

15 minute chart, first red box is the open of the currency trading week, second box is where we are now.

PPHM Just triggered a C&D long @ $2.51

Keep an Eye on TWM

TWM is on the January list, it's trigger for a long position is at $12.58 which it touched this morning.

C&D longs

GLUU has just triggered a Cats and Dogs long position

Tuesday, January 4, 2011

Part one OF Trends for 2011

I'll be covering some of the opportunities that I'm seeing arise, hopefully they'll be somewhat secular in nature.

One of the first is the Fed's plan to buy treasuries on the long end of the curve that can be found in the Fed minuted I posted today from the December 14th meeting.

TMV is an ETF that is bearish on the 20 year, last year we had a decent trade there by buying TMV, it seems that trend may be about to reverse. They said they plan to buy throughout 2011. On tonight's new January Trade List this trend is reflected in the trade, TMF.

I like TMF right here and now, although it's prudent to manage risk.

Here's the chart...
First we see a positive trend in MACD, I use a long version so it cuts out noise and reveals the trend, it is certainly turned positive. Next we have a high volume event that is indicative of a type of capitulation-meaning sellers gathered steam and all sold on that day en masse. Finally in the white box, we see TMF breaking out of the trading channel.

Next on this 15 minute chart, intraday resistance over the last several days is marked by the red trend line, as you can see, TMF is very close to breaking out of that resistance.

10 minute 3C chart. As you can see, today saw a very positive divergence, it looks like a head of steam is building towards a breakout. You could use a limit order, but I personally would have no problem entering this trade in the morning at market.

The 5 minute chart looks just as bullish.

Remember, this is a 3X leveraged bull ETF on 20 year treasuries. ETFs do have some limitations, but this seems to be a fairly good way to play this trend. I believe this could end up being a longer term trending trade, which is my favorite kind. However, it requires that you have a sufficiently wide stop, there will be ups and downs, the overall trend is what we need to be concerned with, not the intraday or even daily gyrations that are found in any trend.

Other 2011 trends that seem to be emerging that will be covered this week include European banks which could be facing a lot of trouble in 2011. US housing and related service industries are another theme. Certain financials will probably develop as the foreclosure crisis takes shape. Certain FX/currency markets are offering some opportunities. Precious metals is unfolding now at a make or break point and there are a lot more. The trade list as well as featured trades will reflect these themes and we'll be looking for the best low risk/high probability setups. I suggest setting alerts on the limit trades, not actual orders. We don't want to show the market our cards ever, including stops. FreeStockCharts.com will allow you to set alerts and use realtime intraday feeds without the 20 minute exchange imposed delay and it's free.

As for the market today, Monday was strong, today was mediocre like we saw late December. As I mentioned last night, the Price volume relationship seemed to be indicating a one day overbought condition and I believe that's why we did not see follow through buying today.

Today the price volume relationship was more moderated with the theme being close down and mixed between volume up and volume down.

Here's what the closing 3C charts looked like

 The DIA ended with 3C roughly inline.

 The Q's looked the worst with a negative divergence
 The SPY looked the best as it was perfectly in line with price.

From the charts above it's difficult to say which way we'll open. There's been weakness thus far overseas so that may filter into the US market but it is more likely a reaction to the lack of upside follow through in the US markets.

Tomorrow I'll continue adding trades. With good risk management, (as per the risk management link) you shouldn't be too bothered with pulling the trigger on trades that trigger. A few subscribers did excellent with PEIX today, but they had to pull the trigger. Good risk management should put you in a position in which any losing trade shouldn't cost you more then 1-2% of portfolio value at the most (although we can't account for surprise gaps other then not investing more then 15% in any one position). In reality you can have a majority of losing trades and still make very positive returns with good risk management.

There were many informative posts today about where the market is at, if you missed them, please take some time and go back to read them.

It's also getting to be about that time in which we take a look at market breadth again, so perhaps tomorrow or tomorrow night we'll take a closer look at the market's internals.

 I'll be adding more trades tomorrow, for tonight, TMF is my favored long trade.
PEIX

PEIX is one of our cats and dogs trades from December 20th, today it's showing quite a gain. The strength of the close and the volume normally will bring about a follow through day of buying.

Precious Metals

Sentiment is a funny thing, so are the words that accompany extremes in sentiment, "This time it's different".

I'm not going to pretend I'm a PM expert, I'm just going to show you what the market has to say.

 GLD 60 minute 3C chart.  You can argue against opinions and such, but there's no arguing with the fact that every time GLD has hit resistance, a negative 3C divergence has met it sending the metal lower.

 Note the very straight trend in GLD, almost looks like program trading ramping it up higher with virtually no pullbacks. Next around November we enter a volatile stage and meet resistance just as gold is hyped everywhere. It seems there's not a person who is bearish on gold. Yet, today GLD sits at the support that has held for nearly 3 months. A break of this support could be a very big and potentially profitable event. Price gets to make the final call, but GLD has certainly seen deterioration in the trend.

 Here we se SLV and the negative divergences around $30-the line in the sand.

 SLV has entered its own bit of volatility, contrast this chart with the one below and take note of support and where SLV sits today.

The white arrow shows another strangely bullish, orderly market, until November when volatility is introduced. These trendline/support areas are going to be important to watch moving forward.

Just Read the FOMC Minutes

I just read the entire publication, interestingly, there are some seeming contradictions there, especially as it pertains to the labor market. It read more like a partly cloudy weather forecast, if it rains you're right, if it doesn't you're right. 


There were quite a few upbeat assesments of the labor market in certain areas, but they were contrasted with the uptick in unemployment from 9.6% to 9.8%. I find it utterly and disgustingly disturbing that it's not just the headline media that continues to ignore the "U6" employment data, which is the broadest measure of real employment as it pertains to real Americans and their situation. Not only does the media ignore this number which is nearly double the U3 headline rate, but the Fed ignores it as well.


There was a statement that I found interesting, although not surprising. The Fed's POMO in which they monetize debt from Primary Dealers leaving the Primary dealers with abundant cash as they sell debt at a profit to the Fed. These Primary dealers have been said to use that money (most likely at the Fed's direction-after all, they are profiting from selling treasuries back to the Fed) to ramp up the stock market. 


In my posts and analysis on breadth readings, the market's total breadth has fallen drastically while the headline averages head higher, translation-fewer stocks are participating in the rally and the PD's can ramp the market simply by buying the most heavily weighted stocks in an index. For a rough example, if the PD's buy AAPL and it's up 1.5% for the day, the 51 least weighted stocks in the NASDAQ 100 can decline by an average of 1% and the NASDAQ 100 will still close up higher for the day due to index weighting.


The Fed all but flatly admitted this in this staement, 


"Household net worth rose further in the third quarter, as an increase in equity values more than offset the effect of a drop in house prices."


Furthermore, I don't even believe it's true! There's barely any retail left in the market, we've had months upon months of withdrawals by retail (consecutively I might add) from domestic equity funds. So participation by retail investors has to be near the lowest point in history, yet those who own houses are experiencing a double dip recession in prices. Even if retail was in the market at a 5 year average, which they are not, their houses are their biggest investment by far. Lets assume you have a $200,000 house and it has declined in 2010 by 10%, that's a $20,000 net loss. The average person who owns a $200,000 house may have $5-$20,000 in the market at most I'd guess and the high-end of that is pretty generous.  The S&P saw an 11.88% change-again we assume that investors caught the entire move-that leaves them with a net return of $594 to $2,376. The middle class is by far the biggest class and probably being hit the hardest with declining housing values as credit for most buyers in this segment is near impossible to come by. How this statement can be true or even close to true is mind-boggling. And where the data comes from , I don't trust it for a minute. We live in Florida, a pretty affluent area with high demand. It's said that real estate has lost about a 1/3 the last 3 years. I know from experience in a wide range of housing prices, that most people who appraised and took out Helocs or refinanced have lost something more like 50-60%. In looking at real estate recently as we were buyers and talking to all kinds of owners, people who even bought before the boom, most of them are underwater around the same amount. For example, a condo that sold for $145k in 2005 is now sitting for sale for 6 months along with 3 others and they can't get $79k asking for it. Friends who took out HELOCS with appraisals at $450k are seeing homes in their area sell for $160-$175k. 


Add to that the severe underperformance of most funds during 2010-as most people don't manage their own money, the stats become even worse. I know there's a lot of hypotheticals in there, but a I said, it's a rough example. It seems this part of the minutes may have been an attempt to justify what the Fed has been doing-it was very prevalent in QE 1, not so much in QE2 and the returns since QE2 will show that.


In any case, the market's reaction? At first, muted. We just saw a quick burst and here's what we have now...


SPY drifting lower after the Fed release, around 3 p.m. a ramp up and a negative divergence that has thus far reversed the ramp up.


In any case, I have some new perspectives on 2011. The January trade list is up now, it's just starting to be populated. I'll cover themes later tonight.

Here's the Minutes

Federal Reserve Minutes December 14, 2010

Market Update

The Fed minutes should be released any minute now. Here's a snapshot of the intraday market.

 QQQQ 1 min. The white is a positive divergence and the red a negative divergence. Either someone is in the know here or we're seeing some hesitation to take prices any higher on this intraday bounce with the Fed minutes due out.

The SPY had no positive divergence, there is a 1 min negative though.