Wednesday, January 26, 2011

SBCF Trade Alert

This is a Cats and Dogs trade that trigged on 1/13/2011 at $1.58. It made nealry 18% on a closing basis and  nearly 23% on an intraday basis. There were follow up post suggesting a pullback and that the bease in SBCF is big enough to support a move to the $2.10 area, perhaps more. Well it's pulled back and has earnings after market-That makes this a double SPECULATIVE trade, but it may be worth a shot. RISK MANAGEMENT is KEY!

There's been some recent accumulation and the pullback is well within the normal trading characteristics of the chart.

 10- minute accumulation as price trades laterally and 3C rises.

The long screen signal remains long and the pullback is to the 10-day moving average which makes perfect sense. I'd say it has the look of a stock that is ready to launch a new leg higher and earnings may be the catalyst to light the fuse.

Remember both earnings and C&D trades are speculative trades, for me that means money I can afford to lose, but they also have shown an overwhelming tendency to give us double and triple digit returns.

Market Update

Just as yesterday we saw improving 3C profiles that led to a higher market today, today we are seeing a lack of follow through on the upside opportunity. This is the type of volatility that wracks all traders nerves and makes holding positions with tight stops very difficult.

 You'll notice all the charts were off to a good start, then turned into an upward tight consolidation very reminiscent of a bear flag. In the case of the DIA, 3C 1 min is just plain negatively divergent and not confirming this parallelogram type consolidation.

 The QQQQ 1 minute is definitely in a negative "Relative" divergence.

 The 5 min looks like a leading negative divergence.

While the SPY would seem to be confirming, it's lower 3C positioning puts it into a relative negative divergence.

All in all, the accumulation we saw yesterday seemed to be stronger then what the market is producing today. It may be that something came as a surprise or a surprise is coming. What I can say is price action with or without 3C is not at all what I expected. It will be interesting to look at 3C if we reach today's intraday highs, that way we ca judge just exactly how much damage is present.

Regarding Mortgage Activity, Here' an Email from my Boots on the Ground


Real time data, it is absolutely dead.  Has been since the last time I updated you.  Very little activity in both the refinance and purchase market at this point (the realtors are perpetually positive and will tell you that people are out looking, but these buyers are very picky and may look at 50 homes before they decide to do anything).  Usually this time of year, we see the beginning of activity in the purchase market.  People start getting pre-approved so they can go out and look, but so far that activity has been very low.  It is my understanding that the existing home sales for last month included about 36-40% REO properties(many may have been cash purchase as well-investors looking to put renters into them…more downside pressure on values within neighborhoods).  That is going to put a lot of pressure on property values as private sales have to compete more and more with the flood of foreclosure homes.  There has been a slight jump in new constructions as those with money would rather build then buy someone’s problem or get what they want (value right now as builders have been cutting margin just to keep people employed and pay the bills).  In addition the market (buyers) overall is expecting a decrease in home values of 10-20%, so many may have decided to wait it out to see where the chips might fall.  The home buyer credit last year sucked a lot of buyers up a year that may have bought this year.  Credit requirements are getting tougher, appraisals are being highly scrutinized and rate adjustments for credit, down payment amount and so for are making loans more expensive then they have been even going back 6 months.   A bigger picture not being discussed…how long do the banks, title companies, attorney’s and peripheral business keep all these employee’s on staff for little or no business.  We could be talking about many, many layoffs in the future. 

By the way, what happens when 1 bank decides it needs to be the first to market with their entire portfolio of bank owned properties instead of the drip approach we have been seeing.  The other banks will come in as fast as they can with their portfolio so they don’t get left holding the bag.  What do you think will happen to the price of homes at that point?  Do we see the FED step in and start buying up assets (foreclosed homes) of the balance sheets of the banks?

Update on DUG, EDZ and TZA

First lets start with DUG, it tried to breakout yesterday and just couldn't pick up the momentum to do so. Sometimes this is because those that are accumulating want to pick up more shares before they let it lose and of course they want to buy cheaply, so sometimes we'll see them actually push the issue off it's highs or breakout. Here are the DUG charts. Just because it didn't breakout yesterday does not nullify the trade in any way. It takes some patience.

 The settings on these Bollinger Bands have acted as support multiple times, so the red trendline is a possible downside target which is also where the wedge support trendline is.

 Here's the 10 minute 3C chart showing where the breakout failed with a negative divergence
The 5 min chart shows the same, but it also is showing some positive momentum or accumulation building as would be the case in the scenario I outlined above. The market was up today, it's natural for these stocks to be down. Bottom line, I personally would stick with the trade, but I like to phase in, a little here and more when the trade moves in your favor-like breaking out. If you are going to average your cost, you do it with stocks working for you, not against you unless you have a specific plan and edge-this may be such an edge.

EDZ
EDZ is another trade I believe we have sufficient proof showing it is being accumulated in the trading range/rectangle. Yesterday as I showed you, the market was accumulating for a green open and maybe close, this effects these stocks in the opposite manner being they are inverse ETFs or short biased. Here's the charts..

 Here' the daily bullish ascending wedge-to the right the rectangle that has been acting much like a base. Note the green volume spikes in that base area.


 Looking at a 15 minute chart of 3C we can see price knocked down at resistance and then increasingly accumulated at support, look closely you can even see this happened yesterday.

 a 10 min chart giving a closer look and also confirming the chart above, yesterday's small double top showed a negative divergence, thus prices are lower this a.m.

 The 5 min chart gives an even closer look, note the multiple negative divergences at resistance, 3C just didn't move up yesterday so what I believe is minor distribution to lower prices to accumulate more, seems to have been the case. Why do I think this?

Here's the hourly chart. The white arrows are accumulation on pullbacks. Note how the drop today barely budged the 60 min chart, so the distribution didn't seem to be heavy, just enough to reverse course. I remain bullish on this trade. If smart money wants to buy more, then fine with me, the trip and gain just lasts longer. That's my analysis of EDZ.

TZA
TZA is a bear ETF on small caps-the Fed has focussed on keeping the Russell 2000 higher through the POMO/P.D. scam. This trade may be early or it may not be, it's difficult to say. As I mentioned last night, something feels amiss in this market. If the market tumbles, TZA will be one ETF you'll want to take a serious look at.

 TZA 2-day 3C chart with a huge positive divergence in leading position.

 Hourly 3C chart shows accumulation at the dips.

 30 min, confirms the above chart, accumulation at the dips.

 5 min chart showing a positive divergence/accumulation into falling prices.

1 min chart showing accumulation on today's dip.

Again, the market works differently then what most people believe. Accumulation is a quiet event, it's not the huge volume spikes that people think is smart money buying, they're much more intelligent then to buy upon rising prices. Those volume spikes are there to make you think they are buying and when you buy, guess who is selling to you? So all these charts make sense. I'm still very much bullish on them all, just don't get discouraged by daily gyrations, in the end they don't matter and you will barely notice them on  historical chart, it's only when your in the trade that they are fearsome. Make sure your stop provides you room to let the trade work and a position size that lets you sleep at night. Trading scared money is one of the cardinal sins of trading and decisions made while trading scared money are often not based in logic, but fear. This is why risk management is vital.

Look Mom and Dad- No POMO Today!

As we have seen way too often to be a mere coincidence, POMO days see accumulation and then a melt-up around 11 a.m. when operations are officially completed and the Primary Delaers pockets are lined with obscene profits for simply flipping a 2 week old treasury to the Fed-no risk whatsoever, billions of dollars for free and it goes right into the market around that time. Today there's no POMO and look at the chart, a little different then yesterday's huh?

Yesterday's strong 3C reading indicating a stronger green open for equities today, but look at 3C around 11 a.m.-is that a leading negative divergence? Yep.

For those of you who have inquired about a simple explanation of how POMO works and how it's tax on us all (as more money is printed, money in circulation loses value), here's a cartoon that sums it up all pretty well.

Mortgage Applications come in WEAK-Refinacne too

Luckily we have a member with bots on the ground. I'm just waiting to hear back as it seems in recent months the numbers released-as bad as they are, haven't reflected how bad it really is on the ground out there.
with all of the revisions and ridiculous numbers we get from every reporting sector of government, it's obvious that at the very least, they tend to err on the side of optimism.

MRNA-PERSPECTIVE

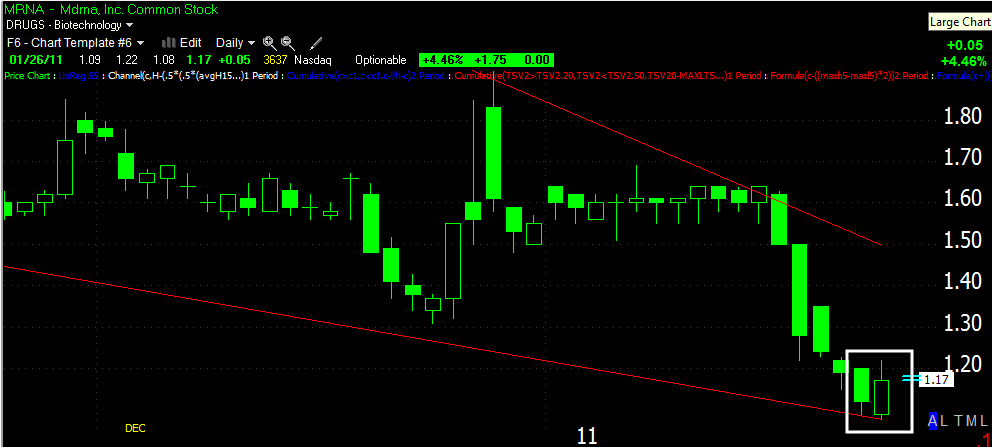
The market is all about perspective, not value. Maybe perception is a better word, but MRNA may be about perspective. This was an earlier C&D trade that didn't pan out, I may have had the wrong perspective.

 The bullish descending wedge is what I may have missed, it wasn't quite there a few weeks ago, bt now it's obvious.

 A closer look reveals support at the wedge support line and a reversal.

 Here we have an important 15 min positive divergence, this is pretty significant.

 The 10 min is positive too
as is the 5 min.

MRNA may be in the process right now of starting a run up and it's still pretty early in that process. This is a C&D trade so it's speculative and your risk management should reflect that.

SSN

This is a stock that I have been working with closely with one of our members, it's a stock he found and we've been keeping some tabs on it. I really love the look of this chart, apparently today there was some news out concerning SSN and HAL that propelled the stock higher. This makes sense because the base that has been built looks like it's sturdy for a significant price advance even from here.

 a 2 year base shows this stock is being prepped for a different class of investors. I can't find the institutional holdings, but I imagine they are high.

 Daily 3C throughout that base has not wavered once, pure positive divergence or accumulation.

 The hourly chart showing the accumulation ahead of the breakout move.

 the same for the 1 min chart-accumulation in front of the breakout, these are most likely market makers/Specialists who know about the order flow and are in essence front running the trade.

Here's the Trend Channel stop. I would like to try to build a position here and but on the dips. The measured target is about $4.50. Although that base is so large, a year from now I think this could be significantly higher, however a lot can happen in a year and right now I'm just looking at the best way to get into a trade like this.

Many thanks to Jack for sharing this pick with us. Jack has been doing excellent with all of the C&D trades and I think he's found my secret to finding them. Nice Job!

Market Update

As I showed you during late market hours yesterday and last night, the market was under accumulation from 11 a.m. on and that indicated a higher open and possibly a green close today. Thus far 3C is more or less in line with price, but it's still early so we'll watch for signs of whether this is a correction or something else.

ALTR seems to be another successful earnings call from yesterday  - 2.45%. As does HTCH +11.53%. ELY doesn't look like it'll make it, but you never know. 2/3 isn't bad I suppose.

DSCO Looks to be moving higher

This is a C&D trade that just triggered.