Monday, May 16, 2011

PSLV Chart Request

Interestingly, after 4 nearly consecutive margin hikes in silver from the CME, there are rumors of more coming down the line. However, theres a source of new competition on the block from the Shanghai Exchange who have actually lowered silver margins and are floating the idea of another drop in margin on silver at the end of business today if silver doesn't show any wild volatility. The CME seems to be operating more like the tax system, once there's a hike, it's there to stay despite what fundamental conditions may have changed.

Here's a look at PSLV which I now favor over SLV for trading.

 PSLV 15 min. is showing a positive divergence into a lateral environment with both divergences occurring at support.

On the hourly chart, there are also 2 positive divergences (although not as well developed as should be expected with the longer timeframe). Again, both divergences occurred when PSLV touched support. It appears as if PSLV is under an accumulation cycle, the question now is how long does it last. It may be worthwhile if you like trading silver, to start building a position whenever PSLV is near support around the $15.50 level. Do be aware that $15.50 is a very obvious stop level and stops may be run before a move higher begins.

XOMA Chart Request

XOMA was a long idea from last Monday, May 9th.

 Heres the recent daily chart, XOMA is holding in a steady lateral consolidation which appears to be part of a larger base. A breakout of the base would occur around $3.19 which would mark the start of stage 2 mark up where the stock usually sees a nice move up.

 The recent 10 min chart is bullish looking and appears as if XOMA is preparing to move higher.

Here's the bigger picture on a 60 min chart and shows the extent of the larger base with a positive divergence throughout the lateral basing phase.

If you want to take a shot at this particular move, a tight stop can be set around $3.02. ADX is just crossing up through 20 which generally denotes the start of a new trend.

I still like this trade.

SPY Update

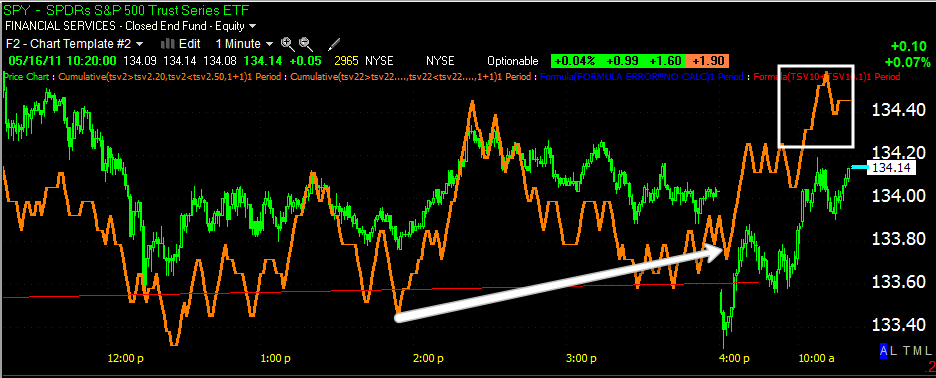
 The SPY broke below the lower trendline, an obvious stop level.

This looked very much like an intentional move. As I pointed out in my last market post, there seems to be a consistent pattern of positive divergences or accumulation at the lower trendline of this obvious price pattern.

This is the obvious price pattern and I still believe the most probable outcome will be an upside breakout from the triangle. I'd also be very wary of that breakout and suspect it will end up turning into a bull trap/false breakout.

However it can be used tactically to enter inverse or short positions that you may have your eye on.

Sunday, May 15, 2011

On Another Front in a Surreal Weekend...

The Arrest of Dominique Strauss Kahn, the head of the IMF "may" have some repercussions in the debt restructuring in Greece, which has now spread to Ireland as well as dealing with Portugal. I have a feeling we'll see some pressure on the Euro this week, the level to watch will be $1.40 as a breach below that level may force technical selling. This should be a strong week for the USD, which could very well have an effect on the market, commodities as well as PMs.

Here's about 5 days of accumulation on a 15 minute chart. We've seen about 6 days up since then, so there's certainly room for more upside just based on the last accumulation cycle.

The EU/USD is trading around $1.4098 right now, so if it loses about a point, we could see a real downdraft  in the Euro. You could use FXE as a short if that happened or go long the dollar, although I think a direct short on the Euro would be more advantageous.

More From This Weekned

Last week a positive divergence was apparent in oil, it seems nothing moves oil like tension in Israel so that's something to watch for this week as tensions are rising rapidly with Egyptian police firing tear gas and killing at least one protester as they tried to storm the Israeli embassy in Cairo. What really heightened tensions though was a group of Syrians and Palestinians that may have numbered in the thousands climbing the security fences which partition off the Golan Heights from Syria. Israeli security forces opened fire with tear gas and live ammo. There were other protests across occupied territories as well.

I just read a good piece from Stratfor this weekend about what it would take to attack Israel and I did a bunch of research about the 6 day war. Whenever there's internal tension within a country like Egypt or Syria right now, there is often a move to create a nationalistic fervor to deflect tensions. Israel would certainly be a target for those seeking to externalize internal  unrest. In any case, fundamentally speaking, oil should see some upside this week.

Energy Stocks Effected by the Opening of the Morganza Spillway

President Obama chose to open the Morganza Spillway  this weekend. Whether the spillway was opened or remained shut, there were a group of refineries and nuclear power-plants that could be threatened. Below is a list of those that are threatened from the opening of the spillway.

Interestingly, short term, most (the entire group, threatened either way) looked like they were seeing short term accumulation as you will see. This may be because of broader based bounce in the energy sector or in the case of these specific stocks below, it may have been a short term bounce that was going to occur because there was a probability that action would not be taken for about a week regarding the decision to open the spillway as the Mississippi River was not expected to crest at the spillway for approximately one week. Theres also the chance that these stocks (all of which are in some sort of long term top) may see a quick bounce regardless of the decision as production at most will likely not be effected for close to a week as it will take some time for flood waters to reach them. In either case these all look like good long term short positions. If they bounce a bit it will present an opportunity to take a short position at a better price. If they will not bounce because the decision was a surprise with regard to timing and they continue lower, that's fine as well, we'll know either way within days. The point being, these should be viewed as longer term trades.

APA-Apache
 APA is barely holding an important support level, a break of that trendline should occur on some volume.

 APA showing signs of recent short term accumulation for a short bounce.

COP-Conoco Phillips-this one was threatened either way, with facilities in the flood zone and in what would have been a flood zone if the spillway was not opened.
 This is a H&S top. Volume on the break of the trendline was helpful in identifying the correct trendline to draw. This has a 6-10 point drop based on the top, maybe a bit more.

 The 3C daily chart showing confirmation of the uptrend and a negative divergence at the top. Also the combo of Stochastics and divergent RSI I use to identify major tops is a pretty clean signal.

 Here's the recent positive (short term) divergence I mentioned. It's right below the break of the top's trendline.

CVX-Chevron
 Agian, volume was helpful in identifying the top's support trendline, which is now broken. MACD (long version) is also negatively divergent.

 CVX daily 3C chart showing uptrend confirmation and a negative divergence at the top.

 Again, the short term positive divergence mentioned above.

PO-Petroquest Energy
 Here's another well formed H&S top that is already broken as of Friday.

 Here's the daily 3C negative divergence at the top

 And again another short term positive divergence like all the others.

SFY-Swift Energy
 The  trendline  here was easy to identify, volume confirmed it on the break. This is already in a primary downtrend and is likely to retrace back to the summer lows, maybe further.

 3C daily did a great job calling distribution and accumulation, right now it's not only confirming the downtrend, but is also in a leading negative position.

 Another short term positive divergence.

SGY-Stone Energy
 Volume again was helpful in identifying the important support level which is now broken. MACD is negatively divergent.

 3C daily did a good job in identifying summer accumulation before the move up and recent distribution. The Stoch/RSI combo is also signaling a major top.

Once again, here's another short term positive divergence.

I suspect these divergences will play out which would be good for setting up a short position. There is the chance though that the earlier then anticipated decision to open the spillway may have caught the accumulators off guard. Either way, when viewing these as longer term positions, a bounce is not very significant.

Friday, May 13, 2011

Dust Settles

Today was a pretty busy day fro me with the site problems, the crazy intraday volatility, etc. However, the idea that  had in mind yesterday was that we would see a false breakout of the SPY triangle which would also correlate with some other resistance breakout zones in the other averages.

I've been looking at the charts after market and it seems like this is still very much a possibility. The issue I have is that the triangle is too obvious. Longer term the market averages don't look good, but it's just not very common to see a market break down or make any kind of move without some head fake preceding that move. Those of you who have been here awhle have seen it time and time again whether it's an intraday head fake or a longer term head fake, Wall Street makes their money by making as many people wrong as possible at any particular moment.

So here's what the DIA, SPY and IWM all have in common.

 DIA sees accumulation at the lows of Wed/Thursday, then distribution sending the DIA back down, today it posts another positive divergence at the sell-off lows today and forms a little intraday bear flag. These bear flags intraday fail all of the time so a move up just based on the bear flag makes sense. However, this all coordinates with the SPY.

 The IWM sees the exact sam behavior as described above.

And the SPY (this is a 5 min chart, but you can see the triangle trendlines), accumulation occurs at the bottom trendline of the triangle, as it approaches the top trendline, distribution (at this point the triangle is not that well developed and I wouldn't expect to see a breakout move yet). Today, just like the DIA/IWM there's a positive divergence at the lows of the day which also happens to be right at the bottom trendline of the triangle. Also another bear flag is formed. At this point, if there's going to be a false breakout (and I believe it will show itself to be false because of the very negative posture of this formation in the longer charts), then they have accumulated enough to make the trip up worthwhile. The bear flag would fail and we'd see the breakout. As I've explained before with the ADM example, there's a reason to create a false breakout, it creates the demand they need to sell short into.

So looking at these charts, I think the probability is still very much on the table. Considering the triangle is now very close to being complete, the timing is also right.

I didn't include the QQQ because as I mentioned earlier, it's off doing it's own thing, but I would think if these 3 majors moved, the Q's would probably follow.

As far as what this would mean for us, if we get the breakout and can confirm it to be a false breakout, we'd have very good positioning on a number of trades. We'd also be that much closer to getting out of this daily volatile chop that pretty much goes nowhere worthwhile and move closer to a trending position that would be worthwhile. That's my take.

SOME OF MY FAVORITE ETF TRADES AND WHY

First off let me say that the May 3rd ETfs featured as longs have done very well and I'm happy with the timing on those trades.

It's important to understand ETFs and that many of them have a 1-day performance period, meaning the ETF managers are trying to replicate 1 day's worth of market action, they are not trying to make their ETF track like the underlying issue over a 30 day period. I'm a firm believer in outperforming the market. Some people don't want to buy "risky assets" like leveraged ETFs, but I'd say to them that those who bought mortgage backed securities thought they were buying an extremely conservative and safe asset. The fact is, whenever you have money in the market, it is at risk. Silver longs recently saw short covering and an asset that was historically undervalued, it seemed like a pretty safe and obvious trade. They couldn't account for the margin hikes the same way buyers of MBS couldn't account for a housing market melt down and all of the fraud that was a part of that. So in my view, if your money is in the market, it is at risk no matter what you are invested in. There's even the risk of investing in something so conservative that you take an inflation related loss. The only way to make money consistently is to mitigate risk through risk management (see the link at the top right of this site for some ideas on the subject).

When investing in ETFs, especially leveraged ETFs, the risk comes from the minute differences in the ETFs performance (they try to match the underlying asset, but often are off in either direction), especially in a choppy environment using leverage. The best time to use a leveraged ETF is when it is trending (in your direction).  Right now, a number of ETFs are very close to or entering the profitable stage of investing, which is after the choppy base, stage 2 or mark up. This is when we have our best opportunity to get a decent trend.

So here are my favorite ETFs, I'll add more over the weekend, but for now, these are the faves and why.

 EDZ- an inverse ETF which is a short play on Emerging Markets. Inflation is the keyword in Emerging Markets and even some of the bigger more developed like the BRIC countries (Brazil, Russia, India and China). The Fed through Quantitative easing has been exporting inflation to these markets and their overheating. EDZ's chart shows a nice, simple rectangle base and this 30 min chart shows multiple points of accumulation at the base's lows. The white box shows 3C in a leading positive divergence which is different then the white arrows which are relative positive divergences. A leading divergence is a sign of heavy accumulation and this is what we want to see when it's taking place right before a breakout. EDZ technically is in a breakout, it may pullback a bit, but it's very close to emerging from the chop and moving toward mark up. There's a lot of potential upside here so if you haven't bought in, there's still plenty of time, this is very early in  the stage in which you want to look at these trades.

 EWV didn't take off right when the Japanese crisis started and we didn't expect it to. Why? Because this as a fundamental development that the market ha no way of discounting, thus they needed to accumulate a position and that takes a bit of time, they also want to do it at the best price levels possible. EWV looks like it's now turned the corner and ready to move toward mark up.

 FAZ has been a long time favorite, it's just been a matter of timing. The fundamental situation with the major banks is horrible for a number of reasons, not the least of which is the fact they'll be spinning off their profitable trading desks. FAZ based out in a nice triangle and 3C on this daily chart has been moving up the entire time. Again, the white box denotes a positive leading divergence as 3C makes new highs while FAZ is relatively low in price.

 FXP is a short on the China 25. China is entering an overheating stage, inflation is high, and  they're facing a massive real estate problem like we did several years ago. Wages are rising and they may start losing some of the production that has driven growth.

 OIH I featured yesterday and showed you the H&S top in place with all of the right ingredients. 3C daily has acted exactly as it should in such a top and while there may be a little volatility around the neckline/support, the bigger view is that of a decent opportunity for a move down.

 TWM is one option for shorting the Russell 2000. It seems that during QE1/2 and the POMO regime, the target of POMO fund flows was the Russell 2000 and for a pretty good reason. The R2k is considered to be one of the broadest averages with all sorts of different businesses. The Fed wanted to portray a picture of the economy getting better and the stock market has long been used as a leading indicator for the broader economy, the problem here is that the R2k was MANIPULATED higher through POMO profits, not from market participant sentiment. Thus the R2k may be the average with the most to lose once QE/POMO ends. It's very close to breaking out above it's downtrend line and if you look carefully, there's an inverse H&S bottom in place. I used Money Stream to show the positive divergences because of scaling on the 3C daily chart.

 TZA

 UNG is a shorter term long trade, there's a good positive divergence in place and a nice flat base, it's also close to a breakout.

 XLK-  Technology Thus far on the daily chart, there's an unfilled gap. There's also a double top. That unfilled gap back in February would be considered a breakaway gap. It will be very bearish if that gap remains unfilled. This would be a position you'd short or buy a similar inverse ETF.

Here's the hourly 3C chart showing a cycle of accumulation and a very negative divergence into flat trade. Divergences occur most frequently into flat trade.

While these are some of my favorite ETFs, and I will add more this weekend, I DO NOT advocate trading in ETFs alone. They are useful in diversifying your portfolio and gaining broad coverage to a weak or strong sector without trying to pick the perfect stock in that sector. However, by no means should ETFs be the bulk of your holdings. There are advantages to being short a stock/equity that you can't get in buying an inverse ETF, more on that here. 

Most of all, I like these ETFs because they are entering the stage in which they are the most useful, in a trending environment.

EDZ

Just a quick look at the longer term outlook at EDZ.

Very Bullish looking ETF. I'd probably fill out the rest of the position on any pullback, you may get your chance early next week.

XLF

EDZ is one of my favorite inverse ETFs, it's a short on financials and I believe financials are going to be among the first to blow up. However we have a break down in XLF below support, on a short term basis, I don't trust this move and think XLF will be back inside the descending triangle next week. I'd still keep my position in EDZ as I mentioned in the second to last post.


 Here's the daily chart

 Here's the 1 min chart showing the break

 a 5 min 3C chart

and a 15 min 3C chart.

I'm not making a bullish case for financials whatsoever, I'm just saying this particular break, I don't trust.