Friday, June 3, 2011

3C=Compare, Compare, Compare

Yep, that's what 3C stands for, a friendly reminder that the more comparng you do, the more reliable your conclussions when things all start to align in a particular direction.

With the price action this week, it has been difficult to imagine that the false breakout that I've been looking for in the market is still possible.

So I went to some of the leverged ETFs to compare the signals among the bull and bear ETFs for the S&P, DOW-30 and the NASDAQ 100 and guess what I found? Consistiency; not only among the long/short of each average, but in all 3 averges. In all there's something like 18 charts, all pointing in the same direction, suggesting the market wants to move higher. If this was the case, I'd expect to see positive divergences in the bull ETFs and negative divergences in the bear ETFs. Here they are....


The Dow Ultra ETFs
 Dow long 5 min-Positive leading divergence

 Dow Short 5 mins. Negative leading divergence

 Dow long 10 min Positive divergence

 Dow Short 10 mins. Negative divergence

 Dow Long 15 mins. Leading positive divergence

 Dow short 15 mins Negative divergence

The NASDAQ 100 ETFs
 NAS. long 5 min. Leading positive divergence

 NAS. short 5 min. Leading negative divergence

 NAS. long 10 mins. Leading positive divergence

 NAS. short 10 mins. Leading negative divergence

 NAS long 15 min Positive divergence

 NAS. short 15 mins. Negative divergence

The S&P-500 ETFs
 S&P long 5 min. Leading positive divergence

 S&P short 5 min. Leading negative divergence

 S&P long 10 mins. Leading positive divergence

 S&P short 10 mins. Negative divergence

 S&P long 15 mins. Positive divergence

S&P short 15 mins. Negative divergence

So there we have 6 different ETFs (Long/Short) on 3 different averages on 3 different timeframes, ALL AGREE. The bottom line, it looks a whole lot like the market wants to move up from here.

Market Update

I suspected that last neg. divergence in the market on the  min may have been a consolidation, it's looking like it was and the market is going to take another crack at filling the gap and seeing what it can do from there.


GLD/SLV

Strange, gold gaps up, silver gaps down this morning.

Lets start with gold, you may recall my macro outlook for gold summed up as a decent size pullback, then there's a good probability that pullback will create a buying oppurtunity (we'll have to confirm that on the pullback, but that's the plan as of now).

GLD's short term action (this morning)

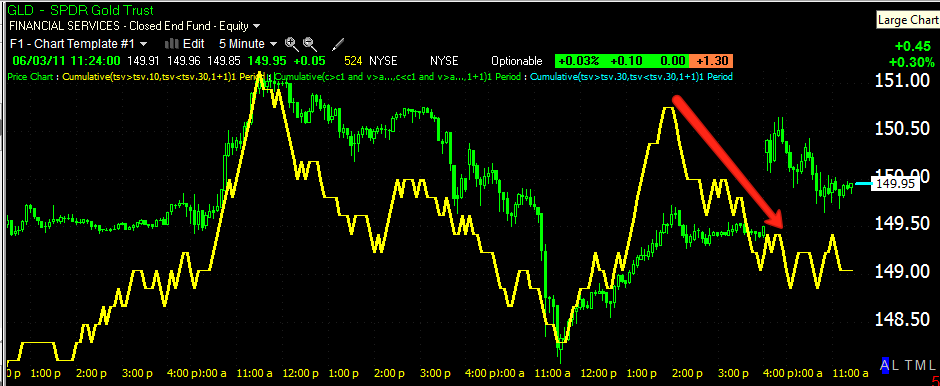
 5 min 3C GLD- There was a negative divergence on GLD on the open, the exact opposite of silver in every way.

 GLD 10 min 3C, still negatively divergent even at higher prices this morning.

 The 15 min chart which tends to be the most influential as to swing moves and longer has been negative and did not improve even by a tick with the gap up this a.m. In fact look at where 3C is compared to yesterday and look at prices right now compared to yesterday. That's pretty darn close to a leading negative divergence.


Of course the daily still looks bad.

So my position on Gold/GLD remains the same despite the gap up this a.m.

As for Silver, I do believe as stated yesterday that there's a very god chance silver will continue lower off the bear pennant price consolidation. However, in the short term (the next day or two maybe), it looks like silver wants to move higher, maybe test the $37.50 level in SLV.

 SLV 5 min positive divergence (leading)

 SLV 10 min positive leading divergence

 PSLV 1 min Positive divergence

 PSLV 5 min positive leading divergence

 As for the longer term discussed, this doesn't change that analysis, the 15 min chart is still negatively divergent.

As is the 30 min chart

This looks to be a bounce of probably a short duration. Silver is headed lower intraday, but if it can form a range and continue positing positive divergences, it will give it that much more power on the bounce.

USO Update

That was a nice little ride, but it's looking like it might be time to take profits.

I'll try to figure out what the bigger picture is here.

Market Update

 DIA 1

 QQQ 1


 SPY 1

SPY 5

The 1 min chart are all negatively divergent, the 5 min charts look like the SPY''s for the most part, so this could be an intraday consolidation, but the DIA divergence is particularly nasty. If I was trading this move up on a day trade, I'd probably take profits and wait for some clarification.

Silver Update

 PSLV 1 min leading positive divergence

 PSLV 5 min leading positive divergence

 SLV 1 min positive leading divergence

SLV 5 min positive leading divergence.

To be clear, these are short term charts that reflect short term moves, so nothing is changing about my Macro outlook for silver, but in the short term they may be an opportunity to make a few bucks on a silver bounce. It's held up well this morning and is positive in 3 timeframes and leading in 2/3.

Go For A Little Ride on the USO Express?

 USO in scale, also didn't confirm the gap lower

Zoomed in and there's a positive divergence, it may be good for a little ride toward closing the gap.

Interesting...

Maybe they did discount the NFP sufficiently? The DIA and SPY 1 min didn't drop to confirm the lows on the open and the market has moved up since, the Q's did drop but went positive almost immediately and have been climbing since.

Maybe they did discount the NFP and are simply fading retail right now.

 DIA 1

 QQQ 1

SPY 1

NFP

Even with the discounting that was sure to have happened Wednesday, I don't think anyone discounted the NFP that far down. 


I suppose we should be on the lookout for any hints from the Fed. There must be a lot of powerful people in Washington requesting immediate meetings with him.

In case you didn't get the NFP number, it was 54k, previously 244k and consensus of 165k.

I think Abysmal is the word.


TRADING The Gold Miners Trade Signal

I recently posted a backtested system for trading an anomaly between the dollar and the price of oil in the gold miners using the leveraged  ETFs NUGT (for long positions( and DUST for short positions. It's important to remember that DUST is an inverse ETF so when a short signal is given, you DO NOT short DUST, but buy it as it is already an inverse ETF. The same applies for NUGT, it's for long signals and is a long ETF so again you buy it. There's no shorting of either ETF ever.

I posted the original system and the returns and statistics looked like this
 Above is the original system returning 64% to date (about 6 months-starting at the origination of the ETF). This system has a decent equity line, 64% in 6 months. As you can see, there were 12 winning trades that averaged 6.77% and 10 losing trades that averged -3.08% for a total of 22 trades. There is a 3% stop loss condition added.

I tweaked the system some more and came up with a 76% return over the same period, but in this case I reduced the number of losing trades trades. Here we have 11 winners at 7.52% average and 6 losers at 3.78% average for a total of 17 trades. The second system is superior in that the average winning trade is bigger (the average losing trade is slightly bigger as well), but it also reduced the number of losing trades by 4 and only reduced winning trades by 1. Overall total trades were reduced by 5 so execution costs are lower and the equity line is higher. The second system is clearly better.

However, the first system produced a signal today, it would be to buy DUST on the open. From the opening price, if DUST were to close 3% lower any day after the start of the trade, DUST would be sold the next day at the open. Every trade will always be at the open with the signal coming the night before.

So I leave it up to you, this system is good and it is giving a signal to buy DUST on the open tomorrow morning. Te other system is better, but there is no signal. So I leave it up to you if you'd like to pursue the signal given today; if so, simply buy DUST tomorrow morning on the open. If you prefer to wait for the better performing system, I'm sure a signal will come soon, it's your choice. Just remember, the stop loss is 3% of tomorrow morning's opening price and would be executed the next morning after a 3% loss has occurred on the close.

The system works best if you treat it as its own portfolio, meaning if you invest $1,000 and make 5%, the next trade signal given should see an investment of $1050, it's in this manner the compounding in the system works.

The statistics are above, it's your choice. If you have trouble reading them, simply click on the image for a larger view.

Good Luck!