Tuesday, June 28, 2011

Market Perspective...

At 1:27 with the SPY trading at $129.27, I showed you the volatility squeeze in the Bollinger Bands that suggested a highly directional move was coming and said, "A move up would be highly suspect at this point."


That's not because I don't think the market has what it takes to break out, in fact I think it has what it takes to break out and bounce-obviously Greek events tomorrow will be influential, but here's the longer term charts of the SPY, which I have shown you (particularly in to the pullback).


 SPY 60 min

 SPY 30 min

SPY 15 min


My comments were more specific about today in which financials are underperforming and volume is exceptionally low for such a move. The market looks as I said, "Stretched". There's nothing wrong with a pullback in an uptrend, it wrings out the excesses, prevents overbought conditions and keeps the trend healthy.


I'd rather see a pullback as long as it holds up technically, maybe holds around the 50-bar m.a. on a 5 min chart or so.


I'd prefer not to see the market try to break through support on an already extended move, there needs to be a local base that it can stage the breakout attempt from.


All in all, the market hasn't added much, currently at $129.36 as  write this, I'd gladly accept a pullback and a base to attempt a breakout, then a $.09 gain.


Current SPY trade...


The TICK Index is starting to move south. 

TICK Index

The TICK Index is showing us something akin to churning in the market.

 In the white box, the TICK Index has seen volatility pick up, hitting the lows of the day around 1:30

Meanwhile the SPY is seeing a volatility squeeze, look at the width of the Bollinger bands earlier today vs. the current reading. The tightening of market volatility with the TICK index getting more volatile is usually a sign of churning, in this configuration typically  strong hands dumping shares to weak hands.

Treasuries

Today it was the 5 year's turn. The bid to cover was 2.59, coming in well below the average, the indirect bidders, just like yesterday backed off again, only taking down 37.6% and the yield surged.

A quick look around the Treasury complex shows trouble in just about every part of the curve.

Here are a few examples:
 This is a 2 year bear ETN so the 2 years are looking bad

 Here's the 7-10 year-looking bad

The 1-3 year looking bad
This is TBF, a 20 year bear so the 20 year is looking bad.

This is all pretty recent, but it seems the obvious question of "who will be the buyer?" with QE2 winding down, has moved from a question to action.

Some possible plays include:

Long TBF (20 year short ETF)
Long TBT (20 year Ultra short)
Long PST (7-10 year Ultrashort)
Long DLBS (Long Bond Bear)
and that's about it as far as ETFs with any volume unless you want to short some of the long ETFs if you can.

I'll take a closer look at these tonight, but the last two auctions have certainly seen a change in perception. 

SPY Update

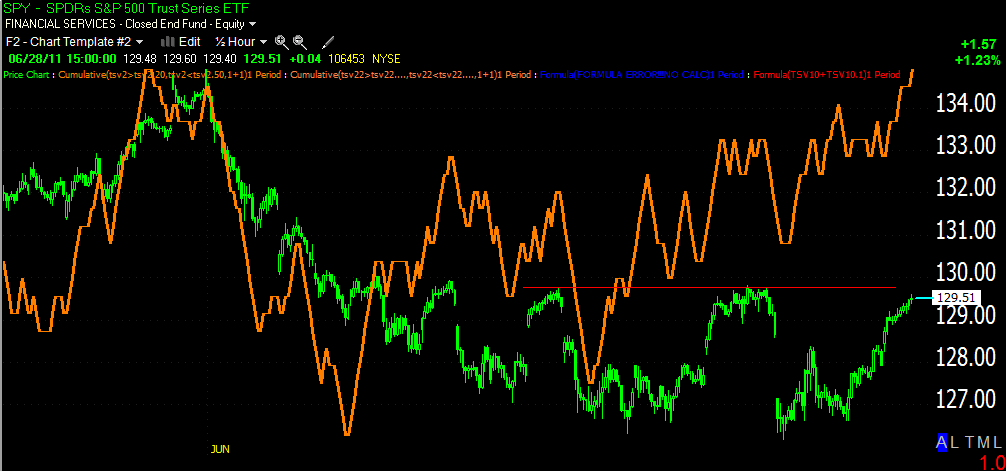
 The daily chart of the SPY looks pretty bullish from a price perspective, closing in on resistance, but I think the lack of volume and the fact Financials are lagging (there's not broad sector participation) is indicative of nervousness about the Greek intermediate austerity vote expected tomorrow. The market seems to be n a very cautious mood.

 Here's the 50 bar m.a. on a 5 min chart, which the SPY has been reacting with very well, a pullback below the average would likely reflect the nervousness about the Greek vote which will dominate trade this week, thus my Sunday night warning "Be nimble"

 Volatility is choking up right now, which is often indicative of a directional move, I'm guessing that move will be down from what I'm seeing, meaning the market looks overstretched and there isn't financial sector participation. A move up would be highly suspect at this point.

And 3C has shown pretty good confirmation today, it's now in the negative.

For short term traders, you might consider a quick trade with something like SPXU, SDOW or SQQQ, but you need to be nimble and I'd certainly use a trailing stop.

Market is looking a little over-extended

 AAPL looks ready for a break

 The Q's are looking the same, AAPL is the most influential stock on the NASDAQ 100

 XLE which has been supporting the S&P is at a gap resistance area

 And it too looks like it's in need of some rest

XLK-Technology is starting to show fatigue as well.

Market Sentiment

I rarely watch CNBC, usually only when I'm waiting to hear the FOMC policy decisions. I did use a video of Cramer on Wall Street Confidential telling Aaron Task how he use to manipulate the markets as a fund manager. That was a good interview and Cramer even said, "I'd never talk about this on my show". One thing he said that I think is a pretty accurate insight is, "The market's aren't about value, they're about perception" or you might say, sentiment.

Interestingly, today the market s behaving pretty well considering Consumer Confidence missed and declined by about 3+ points. As an aside, the CC numbers were out before 10 a.m., so when we talk about embargoes being broken, someone clearly leaked the CC number this morning so yes, it does happen, usually we don't hear about it though or get the information, today was an exception.

Here are the major averages.

 DIA has filled the gap it was having some trouble with and is headed toward the breakout level.

 On 6/21-6/22 I was saying the market wasn't ready to breakout and needed a pullback and there needed to be signs of positive 3C divergence during the pullback. Well we got the pullback the next day and this 15 min chart of the DIA shows the pullback was a healthy one.

 The NASDAQ has gone ahead and broke out. Volume wasn't special, but we do have a breakout there.

 And the hourly chart of the QQQ pullback

 The SPY has filled the gap as well and is close to the breakout area, even with financials lagging the market severely.

 Here's the SPY pullback

 As  mentioned, the S&P is up, if it weren't for energy, I don't think that would be the case.

 Financials are at 0% on the day, a major S&P component. Energy has made up for financials poor performance today.

And technology is doing well today, lifting the NASDAQ.

We'll have to see if there was enough accumulation to push through resistance for the Dow and S&P.

As a side note, keep an eye on CSUN, it's doing what was expected and is about $.08 off our target zone.

BCRX Follow Up

Did you set an alert for BCRX? I mentioned BCRX as well last night with a trigger for a potential long trade around $3.90, it has just broken through that level.

 BCRX daily chart with local resistance at the $3.88 level. This entry is also based on a swing trade method for entering long trades. We look for the daily price candle that has the lowest low/lowest high, which was yesterday and go long when price breaks above the signal candle's highs (above $3.88).

 Here's an hourly chart showing the breakout this morning. I'd like to see volume pick up a bit.

Here are some other potential stops, around $3.80 or below the breakout level of $3.88 for a tight stop. ADX, a trend indicator, looks constructive as it is moving up from the 10 area. ADX tends to become overbought with a turn down below 40.

CSUN Follow Up

CSUN is another long trade set up that I mentioned last night, you may recall the overall pattern looks bullish, but CSUN was showing indications of a pullback which is actually better for a long position, less risk, and a better entry point.

 Here's the daily chart, which looks like it's putting in a short term bottom after a substantial decline.

 Last night I said to expect a pullback, the false move is one of our best timing indicators and this morning was no exception. Note the false move in the red square box making new local highs, but it promptly failed as 3C shows.

 Here's the bigger picture on an hourly chart, there's a nice positive divergence that looks like it can support a decent move higher after a pullback.

I used a 50 bar moving average on a 60 min chart as the potential pullback area because CSUN has traded well around the average. Note also that RSI gave a negatively divergent signal on this morning's false move up. Watch for a pullback around $1.90 and we'll take a look at CSUN n that area as a potential long trade.

NUE Follow Up

Last night I showed you NUE and a set up for a long position in the stock.

 Here's the daily chart (you can click on the charts for a larger view). I liked the price pattern in NUE after a pretty decent decline.

This 60 min chart shows you another price pattern and it was on the break out of this smaller triangle that NUE could be considered as a potential long position. A stop can be placed below the support of the smaller triangle or a tighter stop can be placed at the breakout level around $39.40, I'd prefer giving it a little more room. Ultimately we want to see NUE break the larger triangle around $40.40 or so, then we have a chance to see NUE really make some gains. It's a pretty decent looking set up even here and now. I encourage you to create watchlists and set alerts for price levels. If you don't have the software capability, email me and I'll send you some links to programs that can help you out.

GLD/SLV

This post isn't just for our PM traders, but everyone as it addresses a concept that is very common in the market and can give you an edge in timing short positions and as a matter of fact, the concept can be reversed in timing long positions.

Late last week after SLV and GLD had broken major tops, I started talking about the possibility of them bouncing back toward resistance. This use to be a very common setup in technical analysis, it can be found n technical analysis books that are nearly a century old. Through the late 1990's and early 2000's the set up changed, once a stock broke out, you had less then a 50/50 chance of t pulling back (in this case bouncing toward resistance-but for longs, pulling back to support). Stocks would often just take off after the breakout and you had to just buy them at elevated prices or miss the move. Now once again, the concept of the pullback is common in the market and is why I started talking about these two possibly bouncing last week. Although the general concept is back, it's for different reasons, now it has more to due with shakeouts, creating volatility and volume rebates. It's a bit trickier now and often the pullback or bounces are more extreme then they use to be.

 Here's an example of what I'm talking about with ADM and I didn't cherry pick this stock as an example, it was the first stock on the watchlist I had open. ADM shows us a very important support zone for a major top, which was broken starting in at the left side of the white box. Note the bounce back up to former support (now resistance). It use to be that stocks would stop just below that resistance and head back down, it would make for a low risk/high probability short sale. Now, as I mentioned, the volatility is greater, the shakeout factor is greater and we often see a move above resistance, which fools traders in to thinking that the top is now a failed top and they should go long. This is our new edge, many times that break through resistance is a short lived false breakout and an excellent timing indication for a short position, so we can adapt to Wall Street's new behavior and take advantage of it. This new behavior tends to create even more profitable shorts as the longs who bought are at a loss when ADM drops back below the support/resistance level and creates a snowball effect, sort of the opposite of a short squeeze.

It was this concept that had me thinking GLD/SLV may bounce, I had no technical evidence, just the common  of the market. Since then, some technical evidence has emerged.

GLD
 Here's an important consolidation zone, which failed last week after a false upside breakout. The green box is the target area as of now based on the size of the 3C divergence that is present now.

 You can see the downside changed character around this 50-bar moving average on a 5 min chart, and look at today's volume as price moves above that average.

Here's the 5 min 3C positive divergence, the evidence that emerged yesterday.

SLV
 SLV broke down from a similar pattern.

 And has now moved above the moving average this morning.

 Here's the technical evidence in a 3C positive divergence formed yesterday

And here's a rough target. Although I should warn that 3C may continue to strengthen and the target zone could be higher. In any case, a failed break of this bounce, would set up a higher probability trade with less risk. We'll keep an eye on both for some decent opportunities. The bounce can be traded on the long side, although I would suggest an intraday trailing stop as this week should be quite volatile with the Greek vote coming tomorrow.