Monday, July 25, 2011

ATRN _POPS

ATRN was a long trade from June 1st.

The white arrow is the trade idea date, the Trend Channel held this trade through today.

URRE Long Trade Idea Follow Up

When I was asked by several members whether URRE would be a good play for the market bounce, my answer was no, however, while I felt URRE was more likely to pullback then participate, as it has, I also felt that URRE would be under accumulation at some point during that pullback, we are at that point.

 URRE coming out of a bullish descending wedge and forming a lateral base. I feel URRE has great long term prospects as a long trade (buy).

 Here's some aspects of the pullback on a 10 min 3C chart and as I assumed, URRE s being accumulated through the pullback.

The 5 min chart shows the same. While I don't think a reversal is imminent, I would consider getting my toes wet in this long position that I feel has the ability to be a counter trend trade when the market falls.

There are many fundamental reasons why URRE makes for a good long trade besides the technical charts.

Further indications supporting the SPY/DIA

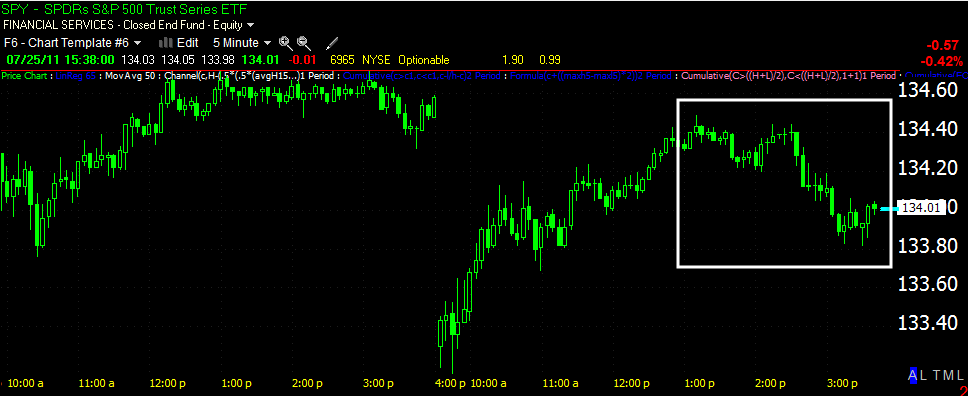
 Here's a broad based afternoon pullback today.

 Note the 3 positive divergences in the DIA, 2 relative divergences and a leading upside.

 No such support in the IWM

 And scarcely a bit more in the Q's, but nowhere near the same as the DIA or SPY.

Here the SPY has the same 3 positive divergences, I didn't draw in the first relative divergence from 2 p.m. to the lows, there's also a second at the test of the lows between 3:10 and 3:30 and a leading positive.

If you are using ETFs to trade short term moves, you might move out of the QQQ longs and into something like UDOW or UPRO, perhaps even FAZ. These are very short term trades, intraday to a day, maybe 2.

USO still on edge

The triangle and Bollinger Bands earlier both supported a directional breakout in USO, so far it's still pretty indecisive, it didn't get far with the upside move and now is sitting on a support trendline. Note the volume spike, this hints that if the support line USO is currently sitting on is broken, volume will surge. 3C showed a slight 1 min positive divergence at 3:28.

Why I feel a continued bounce will favor the SPY/DIA

Lately, over the last year or so, one of the most important concepts giving us a high probability reversal has been that of the false breakout/breakdown. The reasons for this are many, but to name a few, 1) they provide extra trading profits for Wall Street as traders who buy the false breakouts are not only buying at a high price which when the breakout fails will cause them to sell and add more momentum to the downside break, but 2) they are also allowing Wall Street to accumulate a short position right out in the open at high volume (usually Wall Street is quiet about accumulation and distribution so they aren't front run by traders and other firms). However when buyers buy on a breakout, there's usually good volume, Wall Street is on the other side of the trade, meaning they can sell short on heavy volume and not raise suspicions. The false move is still one of our best timing indications.

Here's why I feel continued upside over the next few days will tend to favor the Dow and S&P (DIA/SPY)

 First, sector rotation today favors the Dow especially, but also the S&P and is fading n the Q's Note Tech is sliding, but the important groups for the Dow are gaining, Energy, Basic Materials and more then anything, Industrials. As for the S&P-fnancials have about 22% weight and are important for the SPY as well as energy.

 The SPY has two prospective breakout points at each of the trendlines, those breakouts haven't happened, but would be an excellent timing indicator so long as 3C counts them as false breakouts which would be highly likely.

 The DIA is within range of a false breakout, but hasn't made it yet. This would be an excellent signal, especially if all3 majors ht FB's at the same time roughly.

 The Q's can come out of rotation a bit as they HAVE made the breakout. The Q's would likely see further buying if the SPY/DIA made advances just because the market tends to move together, albeit at different rates of change.

 Furthermore, the DIA produced a positive divergence on the open today.

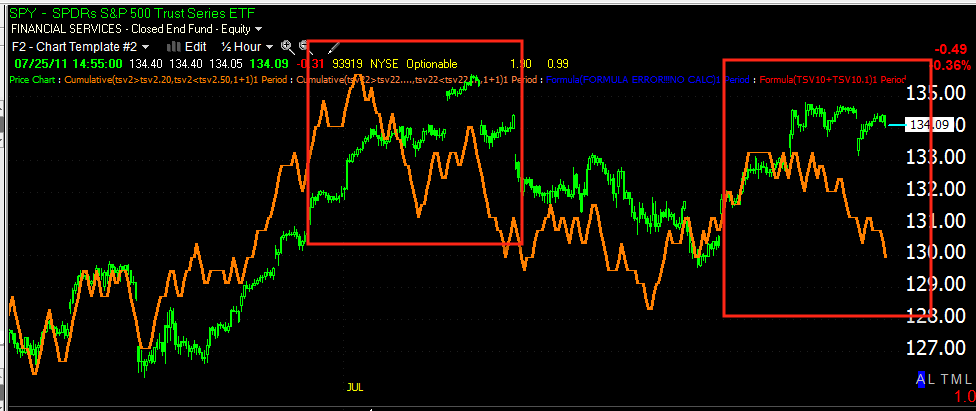
 However, don't let short term charts fool you, the hourly chart is solidly negative, this is why I try to distinguish between a tactical move and a more important strategic move, the strategic outlook for the DIA (and the broad market for that matter) is VERY poor.
 Note Q's did make a breakout, note there was no positive divergence this morning.

 The SPY did, like the DIA, post a 10 min positive divergence on the open. This leads me to believe more attention in further upside, will be focussed on the DIA/SPY.

 Again, the strategic outlook for the SPY is VERY poor.

Here's another strategic outlook of the SPY, once again, VERY poor.

USO Resolution Starting?

Not much volume on the breakout, we'll see where this takes us.

Tech/Q's looking tired.

 Tech Sector with the decline staring around 1 p.m.

 XLK -Technology ETF is in a negative 1 min divergence.

 Note the XLK 5 min divergence around 1 p.m.

 The 15 min chart also s looking tired.

 Note the divergence in AAPL around 1 p.m., it may make 1 more push to new intraday highs before receding.

 QQQ 1 min went negative near 1 p.m.

 QQQ 5 min also near 1 p.m.


The 15 min chart isn't in good shape.

Sector rotation is still favoring the Dow-30/DIA and actually getting stronger; led by Energy, Industrials and Basic Materials.

GLD Update

GLD retraced 62% of today's move from Friday's close to today's high, it's currently at about a 40% retrace and looks as f it wants to move higher intraday.
We have another triangle with some slightly bullish recent 3C readings, this may turn out to be a head fake, but it does appear that it wants to make a move higher into the close.

The Many Possibilities of USO

USO has been a tricky one lately, generally my opinion has been that t would break down, accumulate and then break out of the bull flag for real, thus my short term bearish, intermediate term bullish stance.

We may be reaching a decision point in this ongoing drama and any stock that breaks out and then sits on the breakout level for 3 days is a questionable drama.

 The hourly chart is bullish for USO, thus my intermediate term stance.

 The 10 min chart has been negative almost since the day it broke out of the bull flag and the trendline you see is the top of the bull flag, normally on such a breakout, you'd expect to see follow through buying sending USO higher, instead it has just sat there with the trendline acting as support, but making no progress. I will note there is some slight progress today in the 10 min chart, even though it remains in a leading negative stance.

 Today USO has started a triangle, which would generally be interpreted as bullish, it also suggests a directional move breaking this stalemate, volume is perfect for the price formation.

 Note also how the Bollinger Bands have tightened up, also suggestive of a directional breakout coming shortly.

The 5 min chart remains bullish.

I think we are getting close to a resolution. If we get a breakout that is solid and 3C improves, then I see no reason USO shouldn't continue higher. The other prospect and the one I have felt is more probable is a breakout of the triangle today that fails and sends USO back into the flag, where it is accumulated and then makes a proper breakout with some volume and 3C support. Either way, I think we are finally nearing a resolution. In addition, either way, I still remain bullish on USO's intermediate term prospects.

Last Night's Futures

This from the WSJ 15 hours ago, "Dow Jones Industrial Average futures were down 114 points in screen trade."


From Zawya.com 11 hours ago "Dow Jones Industrial Average futures were last down 131 points in screen trade. "


From the Economic Times 11 hours ago, "Futures for the Standard & Poor's 500-stock index were down about 1 percent. "


From Market Watch, 12 hours ago, " Dow Jones Industrial Average futures DJ1U -0.71% were down 122 points at 12,499 and S&P 500 futuresSP1U -0.82% were down 12.80 at 1,328.20 points. "


From Futures Magazine 12 hours ago, "markets Sunday night with the S&P 500 Emini contract sinking as much as 18.75 points"


From Zero Hedge Last night " And The Opening ES Print Is...


1331.75
Sorry, Timmy, Boehner, and Obama. No apocalypse. Better luck next time.
Update: 1326...
Maybe we spoke too soon.
Update: 1322..."

As you can see, the futures were manipulated last night, causing the bears to short the market on the open, the recovery through the morning puts them at a loss, when they start to cover, we get a short squeeze and maybe enough momentum to get to the breakout levels I've been anticipating since last week. The Q's already made it.

Here's the updated Sector Rotation, which is favorable to the DOW-30.
The most important change for the Dow would be Industrials in purple, Energy s also helpful, but there's a major change in industrials. Tech remans strong supporting the NASDAQ-100

The point is, the sheeple following the futures were deceived. This isn't to change any views on the health of the market, we talk about tactical (short term) and strategic (long term), this was a tactical play to effect a strategic outcome. Remember, nearly all reversals we see (in this case we are looking for the downside reversal) are preceded by a false breakout, The Q's are there, the S&P is close, the Dow is close.