Monday, September 19, 2011

Market Update

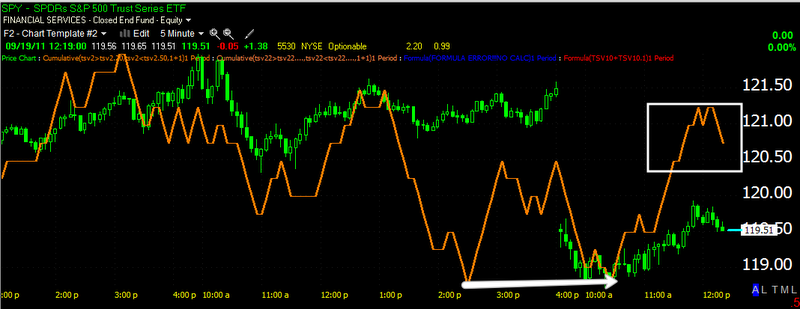
I mentioned already that the DIA, QQQ and IWM have already put in short term 1 min positive divergences indicating a bounce, the SPY was the only hold out, until now.

This is still only a 1 min chart and doesn't have a major impact, but it could be calling out the bounce I have expected since I sold 1/3 of my shorts in hopes of shorting at better prices.

TREASURIES ALSO IMPLYING AN INTRADAY BOUNCE

I was really hoping this Greek thing would be settled today so we can get on with it and see what the underlying action looks lke as we move toward the FOMC announcement. Now Greece says there will be no official announcement, that doesn't preclude leaks and insider trading which we'll be watching.

TLT is the long 20+ year treasury bond fund, it is a risk off trade or a safe haven trade, so when the market is down or going down, TLT rises for the most part.

 You can see the price gains in TLT on market weakness today as we expected, however we also have another short term negative divergence suggesting some kind of bounce.

The longer term charts are showing a very positive 15 min divergence, implying further market weakness as far as the bigger picture goes. At some point we'll also have to be looking at TLT for some hint of what the Fed may do on Wednesday's FOMC announcement.

Greece says not to expect any official announcement

Keep watching the Euro

AAPL Short Term Fork in the Road


We have some topping negative divergences on the 1 min that have halted AAPL's parabolic rise, however, like the QQQ, we have a 1 min positive divergence forming, whether it keeps moving up will be decisive for the short term move. Considering AAPl is in a bull trap area above local resistance, a move higher that turns negative will be most likely, an excellent short position as the longer term charts remain negative.

As 3C suggested...

 The TICK chart is breaking out of the downtrend channel.

 The DIA 1 min continues to add to the leading positive divergence

 The IWM is now showing positive divergence signals

And the QQQ are adding to the leading positive. It looks like the market is prepping for an intraday move higher, my guess, it's related to Greece and will probably be a sell the news event. Either way, it should be a good time to add or initiate short positions if you haven't already. See the list of ETFS in the WOWS model portfolio posted earlier.

Furthermore

The short term 1 min DIA/QQQ charts are starting to get slightly positive, this is for an intraday move.
 DIA 1 min

QQQ 1 min

If you are watching AAPL, it to is seeing some 1 min positive developments and is the main stock that moves the NASDAQ 100. Still, the longer term charts suggest a head fake coming up in AAPL.

TICK CHART Hinting at a Bounce?

 The 1 min NYSE TICK chart is in a channel that matches up with the market action.

Rarely, but sometimes I use 3C on the Tick chart to get a sense of direction, here we have a positive divergence, so we may indeed see the TICK chart break this intraday downtrend shortly, which should coincide with any Greek/Troika news about the next Tranche and whether Greece has met the conditions for disbursement.

Market Update

I may even consider starting to add some back here-I'd like to be a little more patient though, it almost looks like it may be a sell the news event, with the 1 min / 5 min charts slightly positive, but starting to back off and the longer 10-15 min charts still very negative, it looks certain we get more downside, the only question is do we get more of a bounce off Greek news?

 DIA 1 negative

 DIA 5 min in line

 DIA 10 min negative

 DIA 15 min negative

 IWM 1 min negative

 IWM 1 min positive leading divergence

 IWM 5 min positive leading divergence

IWM 15 min negative leading divergence

 QQQ 1 mn negative divergence

 QQQ 5 min in line

 QQQ 10 mn negative divergence

 QQQ 15 min negative divergence

 SPY 1 min in line

 SPy 5 min positive leading divergence

SPY 10 min negative divergence-leading position

AAPL Update

AAPL's 1 min chart was in confirmation earlier, now it's headed south in a leading negative divergence. The red trendline is the breakout area and below that level, AAPL risks a massive head fake/Bull trap.

What's in the model portfolio

These are all ETFs and all bought long, even though most are inverse 2-3x leveraged (short exposure).

ERY
EPV
FAZ
SCO
TZA
SRTY
SPXU
SDOW
SQQQ
TYP
DGP