Thursday, September 29, 2011

GLD Update

 GLD at the long term average or mean, this has historically been an excellent buying point over the last several years, but as I said last night, I think it needs to consolidate along the moving average and prove it can hold it, especially after the way it came down off the highs. Furthermore, it would be nice to see volatility die down to reduce the risk of another COMEX margin hike.

 30 min depth chart shows this as an accumulation zone, not incredibly strong, but the best we have seen since June.

 15 min chart

The short term charts remain choppy and I think that is what we will see for another week or so, some brief rallies followed by retracements. Holding that average will be important for buyers.

Commodities...

GCC 60 min chart distribution at the top


 GCC-commodities, pretty closely correlated with the market

 GCC 5 min leading positive divergence

 GCC 10 min leading positive divergence, it also based/accumulated at the same time as the market.

GCC 15 min leading positive divergence.

I have a feeling I have an idea what this is about, it ties in to the possibility of a longer trend up that I have discussed and the catalyst for such a move. Something was said today that makes this all seem to fit. I'll cover it after the close.

Why I don't trade PCLN

 Look at the daily chart-the old adage, "A rising tide lifts all boats" and the opposite is true, but PCLN has a mind of its own.

 Divergences between the market and PCLN

An hourly chart, SPY vs PCLN.

Model Portfolio Action

I'm going to add back the Options trades I closed out earlier, FAS also looks good here.

I would only add trades/replace if you are already at a profit on the original entries.

Market Update

Some interesting charts, especially considering currencies.

 EUR/NZD

 EUR/USD

 DIA 1 min

 DIA 2 min

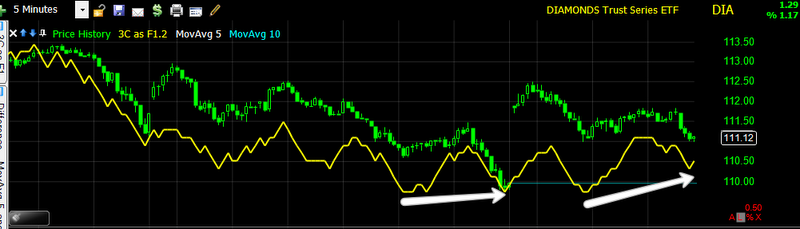
 DIA leading 5 min

 IWM leading 5 min

 QQQ leading 1 min

 QQQ leading 5 min

 QQQ even positive on the 10 min

SPY leading positive 5 min.

All of these good looking charts, suggesting near term upside are strange to see, considering not only that the Euro has been trading down, but that the New Zealand Dollar was downgraded as you can see by the reaction on the FX chart, this is a carry trade favorite and a downgrade means that carry trades will have to be unwound, which should be pointing to market weakness as an unwind in a carry trade usually means selling equities. Very interesting.

The reason I'm not taking profits in the model portfolio yet

This was the pullback in August I mentioned as an accumulation period started to rally, then a pullback of 4.6%, similar to the current situation in which the market has pulled back 3.8%. choppy markets like this are meat grinders and always difficult to trade. Last night after the close, I scrolled back and looked at 3C in all of the timeframes on the August pullback and compared them to the current pullback, the only hart that didn't have enough history to look at was the 1 min chart. In all cases, the charts now look even better then the charts from the August pullback which was deeper and went on to finish it's rally. This is 1 reason, but I also need current evidence and the charts below provide that.

This Tuesday when I saw the negative divergence and warned there would be a pullback, I also took 25% of my profits off the table in hopes that I would be able to add them back at a lower cost basis. I said back then that we have to watch for the short term charts to show positive activity in to the pullback and then I would add the positions back. Longer term charts will take longer and may not show the same positive activity because once Smart Money has moved prices past their average accumulation price, which usually happens quickly, they start to distribute shares, so the longer term charts will deteriorate as the trend up continues as they are selling in to demand. Therefore, the short term charts become important, more so then usual.

 Here's the DIA showing several positives

 The IWM with the Tuesday negative divergence that started the pullback and since then the chart has responded favorably, even putting in a leading positive divergence.

 The QQQ with the Tuesday divergence/pullback and a good relative positive divergence in to the pullback.

And the SPY showing the same. So this is why I am not making any changes to the model portfolio at this time.

STEC Chart Request

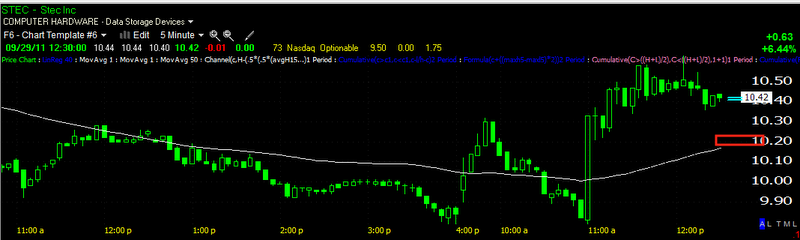
 STEC 60 min chart is inline, but as for the move today, it will not show up on the 60 min chart for probably several days.

 The 30 min chart is slightly out of line and negative, I wouldn't think this is due to today yet as it takes some time to reach the 30 min chart, but there are other charts that seem to agree with this.

 The 10 min went negative on 9/19 and sold off from there, the current 15 min chart, which may or may not have caught up to today's action already (usually it would take longer unless distribution is very heavy) is negative.

 The 10 min chart shows a negative divergence on 9/27 and prices fell, it also shows the start of a positive divergence leading to this move up today, it is out of line with price, it can catch up, but thus far it hasn't.

 Here on the more detailed 5 min chart we see the same negative divergence and a broader view of accumulation yesterday and today, this chart is in line and if it remains so and starts to lead positive, it will effect the 10 min chart positively.
 The 2 min hart also shows a negative divergence and the down side in price from that as well as the accumulation period for this move up, this hart is in line.
 The 1 min chart shows all of the same events so confirmation is good, this chart is negative, for this reason, I would like to give STEC a chance to catch up, so I would run trailing stops behind it if your entry/risk management permits.

 For the bulk of the position I would use a 50 bar m.a. on a 10 min chart, if this is broken, I would consider taking the position off.

I would also use a 50 bar on a 5 min chart to take partial profits to lock in gains, for now, these should allow enough room for consolidation and for the 1 min chart to catch up if indeed we see that. Right now it looks like short term profit taking on the 1 min chart.

I'd give it a chance, but also make sure you can lock in a profitable trade.

Market Update

Intraday pullback/consolidation..
 DIA 1
 IWM 1

 QQQ 1

SPY 1

The next longest timeframe is still in line. I'm going to reduce my options position as I have a full house and a good profit there, I may reduce my equities risk, depending on where the next hour or so goes.

Dollar drops/Euro gains

The post I put up last night showed this was the highest probability via acumulation in FXE and distribution in UUP, if I had to guess, the wide margin that the lower house in Germany passed the EFSF bill was probably well known to those in the know. They played it as if it was an uncertainty, but coming in at 523 for and 85 against, sentiment in the lower house must have been well known for those connected and that seems to have been reflected in currencies yesterday.

Here's a look at the dollar and the distribution as of yesterday sending it lower today.

 UUP 1

 UUP 5

There are some other VERY interesting development out of FAD (you know who)  that I will cover in a bit, they fit right in with some of the longer term 3C readings we have been seeing for a while.

Market Update

 DIA 1 min positive
 DIA 2 min positive


 IWM leading positive

 IWM 2 leading positive

 QQQ 1 leading positive

 QQQ leading positive

 SPY 1 leading positive

SPY 5 positive

Now that the morning trade is over, we should see what they're up to