STEC 60 min chart is inline, but as for the move today, it will not show up on the 60 min chart for probably several days.
The 30 min chart is slightly out of line and negative, I wouldn't think this is due to today yet as it takes some time to reach the 30 min chart, but there are other charts that seem to agree with this.
The 10 min went negative on 9/19 and sold off from there, the current 15 min chart, which may or may not have caught up to today's action already (usually it would take longer unless distribution is very heavy) is negative.
The 10 min chart shows a negative divergence on 9/27 and prices fell, it also shows the start of a positive divergence leading to this move up today, it is out of line with price, it can catch up, but thus far it hasn't.
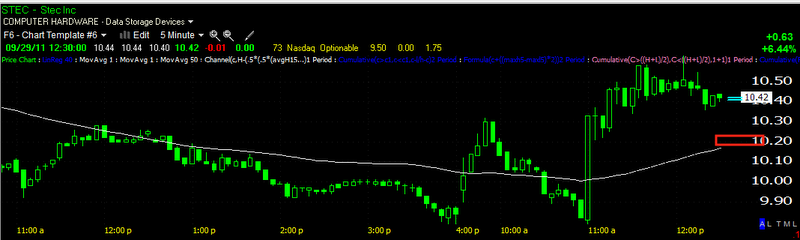
Here on the more detailed 5 min chart we see the same negative divergence and a broader view of accumulation yesterday and today, this chart is in line and if it remains so and starts to lead positive, it will effect the 10 min chart positively.
The 2 min hart also shows a negative divergence and the down side in price from that as well as the accumulation period for this move up, this hart is in line.
The 1 min chart shows all of the same events so confirmation is good, this chart is negative, for this reason, I would like to give STEC a chance to catch up, so I would run trailing stops behind it if your entry/risk management permits.
For the bulk of the position I would use a 50 bar m.a. on a 10 min chart, if this is broken, I would consider taking the position off.
I would also use a 50 bar on a 5 min chart to take partial profits to lock in gains, for now, these should allow enough room for consolidation and for the 1 min chart to catch up if indeed we see that. Right now it looks like short term profit taking on the 1 min chart.
I'd give it a chance, but also make sure you can lock in a profitable trade.


 | Theme by Thur
No comments:
Post a Comment