Thursday, October 13, 2011

Short Term SPY Update

 SPY 1 min negative relative divergence halts the advance

 Same on the 2 min

However the 5 min is still leading positive intraday and until that changes, I would think there will be more intraday upside into the gap.

Getting ome market movement

There's some momentum intraday as the market moves toward new highs on the day and there's a bit of volume there. I still need to check the options chain for a possible expiration pin tomorrow.

A couple of hours ago, as predicted, Slovakia passed the vote on the EFSF and as I alluded to, it looks like they'll be getting a new government for doing so. When this first became an issue I said that they're a small country, susceptible to bribes and other things.  I'm wondering how much campaign cash the opposition groups received from some EU entity so they would cast their votes for the EFSF and thus, have a chance to finally move from the minority to the majority.

There has been some movement in the Euro since the vote was passed, which of course relieves the bearish tension in the market and should effect oil and some other commodities positively for however long this lasts. I think the last semi-rhetorical question I asked about the day that this vote would be passed, which wasn't in doubt, was "Sell the news?" We'll see. For now, it's time for the knee jerk dance.

 EUR/USD 1 min from about the time the vote was passed, the best I can tell.

SPY 5 min which has shown some positive divergences suggesting an intraday move into the gap.

USO Update

Yesterday morning  posted, "Long USO? Better Be Careful"

Today, she's lower and the warning signs were there, as a matter of fact, I included charts of the Crude Short, SCO.

Let's take another look...
 USO 1 min went in to a sharp relative negative divergence yesterday when I first posted in the morning there was trouble there and then in to a worse leading negative divergence. Right now it's trading about in line/confirmation of the trend, with 3C.

 The 2 min chart shows numerous little accumulation and distribution areas going up, but that leading negative divergence in the red box, especially yesterday, was an ugly sign for USO, again currently trade is roughly in line.

 5 min on the move up we have 3C higher highs with price/confirmation of the trend (green arrows) and the last 2 days a nasty negative leading divergence, nothing has changed since as far as 3C signals.

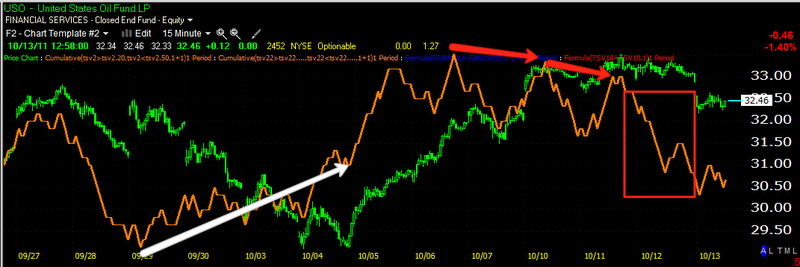
 USO 15 min shows very strong accumulation (white arrow) and distribution in to higher prices, then a leading negative divergence, trouble was clearly foreseen by Wall Street.

 USO 30 min, another leading negative divergence-the strongest kind of divergence and on a long chart like 30 mins is a big warning that something is not right.

Even the 60 min is lagging now.

I don't personally have a problem being short Crude here with something like SCO, although any intraday strength would be great as an entry point.

GLD Update

I know for sure in the last GLD update we talked about a pullback.
The daily GLD chart with the long term 150-day moving average, which over the last 2 years has been an excellent low risk buying area. However, I said that I thought GLD needed to consolidate along the moving average and hold it because it fell pretty hard getting there. Recently GLD (the last 3-4 days) has been a little high and away from the consolidation zone, so a pullback to the m.a. has been expected


GLD 1 min shows a negative divergence yesterday, a positive relative and leading divergence on the open this morning, sending it a bit higher into the gap, however, the 1 min is now going negative again, suggesting it likely won't fill this gap today.

The 5 min GLD chart shows a previous negative divergence and prices dropped a bit (that may have been around the time of the update in which I said it looks like it needs to pullback/consolidate), however it moved higher on a weaker $USD and formed an island top yesterday, which was leading negative. The 5 min chart also shows an intraday positive divergence (white) sending it off its lows.

 The 10 min shows the distribution these last several days as it remained out of the consolidation area below. There's what appears to be a positive divergence, however I suspect the 10 min chart just hasn't moved fast enough yet and I doubt that holds.

 The 15 min chart as well has shown distribution in to these elevated levels away from the consolidation, a leading negative divergence. In the white box you see the Island top, which in my view was also a type of head fake/bull trap as it made new local highs.

 The 30 min chart, showing a good accumulation period which I believe is part of the consolidation, however, I also believe that gold prices reacted to the weak dollar and were pushed higher. It appears this strength was used to distribute in to, and also to help move GLD back to the consolidation area below.

The 60 min chart looks quite negative the higher prices move from the 150 day moving average. If GLD does hold the 150 day and it is so obvious now (buy the 150-day)  that I wouldn't be surprised to see Wall Street try to pull off a head fake with a break below the average, however, should it remain strong, it seems like this 1-2x a year opportunity may be being used to load up on GLD shares on the cheap by Wall Street and others.

SLV/Silver Update

 SLV 2 min with several positive divergences (white) and negative divergences (red), the latest is a leading negative divergence in the red box.

 SLV 5 min a relative negative divergence.

 10 min again with accumulation/distribution -right now the 10 min is pretty much in line with a move toward a leading negative divergence.

 15 min accumulation areas (white) and currently in line with prie (green)

 I believe we talked about this in the last SLV update, the 30 min chart is showing negative divergences, in the yellow box is what appears to be a trading range/base that is underway, so it seems SLV is accumulated near the bottom of the range, sold off to bring it back down when it gets too high in the range. So this appears to be a larger base under construction.

The 60 min chart would tend to confirm this with solid positive leading divergences.

Short Term SPY Update

It takes so long to capture and post all of those charts, the short term charts can move quickly, so here's an update of the short term charts.

 The 1 min looks a little stronger now

As does the 2 min.

Even though the positive divergences have already caused at least a lateral consolidation, I think there's a good chance of an intraday bounce in to the gap. I personally would use that intraday strength to add to my short positions. Ultimately though, $118 is still the level I'd like to see broken before getting very aggressive. We also have GOOG earnings at 4:30 so a bounce could be used to get better positioning and lower your risk as you'll be closer to a stop out level.

Full SPY Update

I have a lot of charts to look at some I'm updating all the SPY timeframes, but I don't have time to do the same for all 4 averages, although they are all pretty similar, except the SPY 15 min has been generally stronger the most of the others.

 SPY 1 min 3C had a positive divergence that sent SPY somewhat lateral, there's a possible second divergence building which could be an attempt to fill some or all of the gap.

 2 min Again, there's a possible positive divergence building here.

 The 5 min SPY chart is in line with price-marked by the green arrow.

 However, remember how ugly this 5 min chart really is, this is a zoomed out version, it's truly in a leading negative divergence, as are most of the other charts when zoomed out.

 The 10 min chart is leading negative

 The long term 15 min is still in confirmation which is strange, even though it is rightfully the strongest of the 15 min charts among the averages as it had the longest accumulation period, but looking at the 10 min before and the 30 min after, it seems it should be negative.

 The 30 min with a relative negative divergence at the top

And the 60 min is leading negative for about 4 days, which if you recall is when distribution started showing up.

All in all, not a pretty sight and I'm still holding my inverse (Short) ETFs which include: SDOW, SPXU, SQQQ, SRTY, FAZ, TYP, TZA, and EDZ.

I'm still thinking a break of SPY $118.00 completes a pretty large head fake and should cause a selling snowball effect.

Economic Reports

Jobless Claims out this morning were a non-event coming in at 404k vs consensus of 405k and a prior reading of 401k, so still above the 400k mark, but a bit better then consensus.

The US/China Trade War is at risk of escalating after the Senate passed a bill about China pegging the yuan at a low rate, The PBoC responded for the second day in a row by lowering the peg. They aren't worried about risking inflation at this point, they are bent on firing a few salvos back at the US. We'll have to see if this escalates, it won't be good for the US markets if it does and will surely have an inflationary effect on China.

Quick Early Market Update

 SPY 1 min relative positive divergence (white)

 SPY 2 min slight leading positive divergence

SPY 5 min is trading in line with price.

It looks like typical morning action, there should be an attempt to fill some or all of the gap, but the signals are still early, even the 2 min is still developing.

GOOG Earnings Correction

They are not pre-market, rather at 4:30, maybe we will have an earnings call trade, last time we got the signal on GOOG 15 mins before the close and got it right.