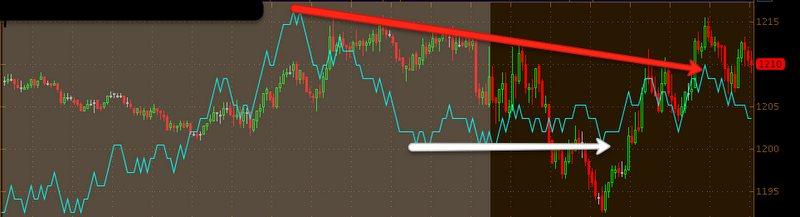
ES EOD 1 min 3C did a good job of identifying the intraday bounce off the lows, as was posted in an SPY update there was the start of a negative divergence once the bounce got under way, that is reflected in this chart as well at the red square, which led to a slight pullback within the bounce and then a positive divergence (second white arrow) that finished the bounce up. There's a red arrow at the far right, but actually 3C is more in line there.

This is the 5 min ES (I've noticed divergences in ES are more powerful, a 5 min divergence is probably more like a 10 min divergence in regular hours on something like the SPY.) We have two relative price points that are the same, one from very early this morning, probably around 5 or 6 a.m. and the intraday high during regular hours. There's a negative divergence between the 2 points, so that's a relative negative divergence and it's probably somewhat meaningful being it went negative during regular hours when the ES volume is much higher, so that would be a stronger signal of distribution given the much heavier volume.

This is the 15 min ES (probably closer to a 30 min chart in the regular market on something like the SPY).Again there's a negative divergence in regular hours at the same 2 relative price points, so once again, distribution during regular hours when the volume is running much higher is a significant point to keep in mind. So what this shows us is a bounce during regular hours that was used for distribution, which as I pointed out last night can be selling or short selling as both actions register as a sale on the tape.
Market action during Op-Ex week (tomorrow) is usually choppy on it's own, we also have what I would call a top, which is almost always choppy and volatile. It can be helpful to use some technical tools to keep focused on the trend rather then the intraday or day to day chop.

Here's a simple moving average on a 60 min chart of the SPY, which reminds me of a saying, "The trend is your friend until it starts to bend at the end". Clearly the moving average depicted an uptrend which is easy enough, but now when the market is choppy, it is showing more of a lateral trend. If you remember my article about the SPY and the accumulation that it accrued during the 10+ week trading range, it made it very easy for the market to turn up in to this rally, very quickly in a "V" bottom. If you understood that article, then you probably understand that it was a lot of shares to be distributed and to start a short position, there would have been no accrual of shares short, meaning it would take more time and a lateral trending environment is often where this kind of underlying action takes place.
ADX can also be used to identify the end of a trend when it crosses above 40 and then turns back down below 40. The current reading of 18 shows a market that has no strong trend-lateral isn't considered a trend with ADX.
A Linear Regression channel is also helpful in a few ways, first it defines the break of a stable trend and secondly, there tends to be a "Kiss the channel goodbye" effect after a trend breaks and before it reverses, This is a steep channel, but the day or hour rather, marked at the red arrow shows a move that was probably pretty close to the bottom of the channel, it also had a long upper wick on the candle (which is resistance-possibly from the LN channel) and heavy volume, which is indicative of churning-another spot distribution is often found. The opposite of churning in an accumulation area would be capitulation.
While we have several indications above that the 18th at 4 pm was a churning event, we can also look at 3C during that same period and as expected, there's a leading negative divergence in to that rally that created the churning on the chart above this one.
As far as some other indications, MoneyStream is a good money flow indicator, similar to 3C, however it rarely gives a signal so I don't use it often, but when it does give a signal, they are usually pretty solid. The more pieces that fit, the stronger your analysis.
As you can see, MS gave 2 signals at the top, but even the last 1 which 3C was very clear about, isn't that distinct if you are not use to looking for divergences. However the current MS signal is pretty clear. I drew a trendline as a point of reference and just like 3C, if there were accumulation or even flat confirmation, MS would mimic price, instead price makes a slight new high for the consolidation while MS trends down, making a new low as it goes.
I'll be back with more in a little bit.




 | Theme by Thur


