Saturday, October 22, 2011

Do you have feelings of inadequacy, lost, confused, scared?

Well guess what, you are not alone! No I'm not selling a wonder drug, I'm reflecting on the market right now and how it has many of you pulled in two separate directions, both based on what you see. 


Market tops are notoriously hard to trade, when teaching Technical Analysis, I told my students that most of the, especially if they weren't comfortable shorting stocks, should just put their money in some form of cash. The bottom 10-20% and the top 10-20% are the smallest scraps and the hardest to get. The 70-80% in the middle s the east money.


Throw in a bear market rally, (which exists for one thing only, to cause you to doubt the bear market and re-enter equities, thus they are VERY convincing) and a choppy trading range as well and you have one of the most difficult market areas to trade. To make matters worse, HFT trading causes distortions and the fundamental issues right now are something our generation has never seen or traded, in fact this is probably more complex then the Crash of 1929. Not only do you have to understand American economics, the "Feral Deserve", currencies, European politics and economics, terms like EFSF, Troika, Credit Default Swaps, Reserve Banking, Dark Pool markets, PrimeX and throw on top of that  new level of market manipulation and inside knowledge/trading. Did I forget anything? 


So it's not you, it's an unprecedented market, that is very complicated and very corrupt. It's no wonder that the week ending October 12th saw the 8th consecutive outflow of money from equity mutual funds in the form of $5.9 billion dollars and $99 billion so far this year. 


Whether you are a bear or a bull, it's been exceptionally difficult this week with the open on Monday to the close on Friday gaining +1.6%. The week looked like this -2.34%, +2.35%, -1,18%, +.44%, +1.88%. Whether long or short, the day to day was quite an emotional roller coaster. 


I have put together some charts to help you better understand where we are, possible reasons why, where we are likely heading and the condition of the market. Price and trend changes don't just happen one day because of "XYZ" news, there are warnings that if you look for, you'll know XYZ news wasn't the reason, it's just a catalyst or a cover.


First lets look at a way to identify where we are. My first few quarters teaching, I spent 2 of 8 lasses on Dow Theory or Trend classification. For most people it was a waste of time as the subject an be complicated for new traders, so  modified it and taught there are 3-4 main trend, the 3 main trends are Primary as in bull or bear market, Intermediate and Short. The short term trend is easy enough to figure out so I look at Primary, Intermediate and Sub-Intermediate. I use moving averages to define the trends, not whether a stock is above or below the moving average, just simply which was the moving average is slanting (up for a bull market, down for a bear market and sideway for a lateral/transitional market.). I use the 200 day daily average (blue) to represent the Primary trend, a 50 day moving average (yellow) to represent the Intermediate trend and a 22 day moving average (red) to represent the Sub Intermediate trend. A short term trend can be defined by a 5 or 10 day moving average.


 Here's the 2007 market when the Primary trend was moving from transitional to a bear market. The sub-intermediate and intermediate trends will give you early warning as they stop trending with the sub over the intermediate and start criss crossing, this is a sure signal of a top or bottom.


 In 2008 we re in a clear Primary Bear Market. Here I count at least 3 decent bear market rallies. One lasts nearly 3 months. Remember that a bear market rally has a purpose and for that purpose to be fulfilled they need to look convincing. People are inherently optimists in the market so they give a bear market rally the benefit o the doubt, but there still needs to be enough of a move to sucker people back in to the market. I've looked at a lot of tops and it is not often that a top that breaks down turns around on what would be considered a bear market rally. The 1929 crash had at least 5 bear market rallies, and bigger then anything we see here.


Here's the current situation, note the criss-crossing of the yellow/red moving averages and the Blue 200-day turning lateral and now down. Don't discount this turn of the moving average. Even in 2010 when the market traded down and laterally after the end of QE 2, the 200 day NEVER turned even slightly down.


Here's my Trend Channel going back to 1995. A stop out would be a CLOSE below the highest point of the lower channel for a long and a close above the lowest point of the upper channel to end a bear market. Toy can see the 200 Tech Bubble Stopped out, but not 1 single stop out from 1995 to late 2000/early 2001. The Tech bear market was stopped out in 2003 leading to the last bull market, there wasn't even 1 false stop until the channel called the end of the bear market in early 2008. The decline from there was held perfectly in the channel and it was ended at the "FAD" intervention in early 2009. Even with the 2010, end of QE2 market pullback and 4 month consolidation, the channel did not stop out the long trend until just recently. Looking at the charts above, it is very hard for me to come to any other classification then, "We just entered a bear market". 


That doesn't mean we won't see counter trend rallies that cause doubt as to whether this is truly  primary bear market.
 Her are 5 gear market rallies after the 1929 crash. Note the first is the strongest/longest  and they get smaller as time goes by,  suspect this is because after several year of a downtrend, people are expecting the new uptrend to start any minute. Still, the Dow saw a 89% drop.


 This shows the 3C depth chart for the 200 Tech Bubble, the 2007/2008 Sub-Prime Crisis and where we are currently. In red with price is the 200 day moving average and the green arrows point out when it turned down which has some correlation with the depth harts turning down from their deepest crest. I know this is controversial, but 5-10 years down the rad, I believe the market will be interpreted this way, I believe the 2009-2011 was a historic bear market rally, that's why I believe it is not quite s deep as the 2008 crest. I also believe when this is all said and done, we will see the first secular bear market in equities, and this entire region on this chart may be interpreted as one very large top. If so, then you can get a rough target by measuring the bottom of the pattern to the top of the pattern and deducting that amount from the bottom of the pattern. This was my belief (the downside target) back in 2007 when I recored the 5 videos about market bubbles that I recently posted here.


As far as the crest turning on the 3C depth hart that I mentioned above, I drew some vertical trend lines to show you that correlation.


Finding an edge in the market isn't done by looking at one indicator or a series of indicators, it's not found in one index, finding an edge means looking at as many pieces of the puzzle as you can and seeing if a pattern emerges. This is where discipline really come in. Sometimes looking at harts can be as subjective as looking for animals in the clouds. We always want to approach our analysis with no bias and let the charts, if they speak to us, tell us hat the most probable outcome is. You will never find every chart you look at in agreement with the majority, but when you have a solid majority, you have high probabilities and can form a strategy and then use weakness or strength in the market as tactical opportunities to further your strategy.


So you have seen 3C charts every day. 3C is based on one of Don Worden's indicators and this is a man who could be considered the godfather of all moneyflow indicators. Everything from cumulative money flow to On Balance Volume was derived from his work in Tick Volume. So we'll take  look at his MoneyStream indicator, one that gives excellent signals, but they are few and far between.


 MoneyStream is interpreted the same way as 3C, look for divergences between the indicator and price. This shows the negative divergence at the 2007 top.


 Here we have a positive divergence at the 2009 bottom.


Here is the current 2011 top with several negative divergences-in May, July, early to late July and during the recent consolidation as well as a lagging or leading negative divergence on this last rally. Note the S&P-500 hit new highs on Friday for the 10 week consolidation/trading range, yd MoneyStream is just off it's lows. I should have continued the red area to Friday's close.


We can also get some clues by looking at currencies. First we'll start with the Australian dollar which in the past has led the market by either bottoming or topping before the market, so it acts as a leading indicator rather then a lagging indicator as most indicators are.


 FXA=Australian Dollar (green) vs the SPY (red). In 2009, the Aussie was already making higher lows (an uptrend) while the market was still bottoming. In the run up to the decline based on QE1 ending, the Aussie topped while the SPY made a new high, just before the decline. Coming out of that decline, the Aussie was in an uptrend while the market was still bottoming. 


 Here's a close up of trade now From June-present, note the Aussie saw a decent bump up to a new high (white box), shortly thereafter the S&P made a new high (just this Friday), however the Aussie is now starting a downtrend with lower lows/lower highs (red arrow). We've used the FXA successfully this year to predict even short term moves.


 Looking at 3C for the FXA, you can see similar accumulation like the market and similar distribution currently on this 60 min chart.


 FXA 30 min chart is also negative-these are substantial timeframes.


 The 15 min chart shows some history if you are to follow the divergences, but most important is the one to the far right, another leading negative divergence.


And the 2 min chart-leading negative as well.


Now to the Euro


 By looking at this long term chart comparing the S&P (green) to the Euro/FXE (red) you can see in the past the correlation wasn't close to 1.0, however, Wall Street tends to herd together with each firm buying or selling the same as the other firm because no one wants to underperform the herd, very few will risk their multi-million sometimes even billion dollar management fees chasing performance and prefer the safety of the herd. Perhaps that is why all of the algos have recently been programmed to chase the Euro, which you can see in the white box. This is a fairly new 1.0 correlation.


 As for the FXE 60 min 3C chart, it's leading negative.


Remember several months ago  told you that the dollar seemed to be under accumulation? Here's the actual Dollar Index-unfortunately there's only daily information for this so I use UUP for intraday. The accumulation in the dollar has continued. The last time this happened in 2009, it was a huge mystery. There was nothing that suggested the dollar would rise yet 3C kept posting a strong positive leading divergence, just as now. Eventually the dollar rallied for about 6 months and several months into the rally, the Bearded one came out and sad the US was pursuing  "Strong Dollar Policy". A few other things happened after that which helped to explain why the dollar was under accumulation. However back then the algos weren't programmed like they are now and a rising dollar would mean the algos (as programmed) would sell en' masse.  Interestingly, this s nearly the same price pattern seen in 2009- a descending bullish wedge with a similar 3C daily positive divergence.


Now lets take a look at a few of the T-2000 indicators. The indicator is in green and the comparison symbol which is usually the S&P-500 unless otherwise specified, is in red.


 Percentage of stocks trading 1 channel above their 1200 day moving average. As toy can see, this indicator called the last two rallies a negative divergence before the market fell in late July/early August. Like most indicators we are looking for divergence between price and the indicator. The most recent rally which has been the largest rally (in fact the biggest 1 week rally in 2 years) has failed to move the indicator up to even the high of the second rally in August.


 Percentage of stocks trading 2 channel above their 200 day moving average, this indicator has been declining for some time, indicating a top since early 2011, as 3C and other indicators went positive at the bottom of the decline, so did this one, halting the early August decline, however, since the last rally, the indicator is moving in the wrong direction, lower then it was at the start of the rally.


 The Cumulative 4 week New Hi/Low showed a mild negative divergence between May and July, it is showing another between August and October.


 The McClellan Oscillator has shown several positive and negative divergence ( positive in white/negative in red). It is said of the MCO that even small divergences can lead to very big moves. The MCO is negative between the August High and the Friday high, but the small divergences that we are t watch for in the MCO are apparent at the end of this recent rally and another one can be seen at the small red box within the larger red box as well as the second white box from the left which was significant because it halted a serious downtrend and caused a 10+ week consolidation.


 Here's the NASDAQ Composite Advance /Decline line so the symbol being compared is the NASDAQ Composite, this is not the same as the NASDAQ 100 or QQQ, this is all stocks trading on the NASDAQ network, a VERY broad and diverse index. As you can see, the Advance /Decline line has been in a downtrend, despite the market, especially the NASDAQ, making new highs. There was a divergence also right before the market plunge.


This is just percentage of stocks trading above the 200 day ma. (no channels), it went negative before the plunge and has filed to make a new high or even keep up with price generally.


Now some intraday breadth indicators


 This is a momentum/breadth indicator and it shows what percentage of stocks hit a return of 5%, 10%, 15% and 25%. The thing to remember with momentum indicators is the saying (slightly modified), "The Trend is your friend until the end when it starts to bend", meaning, when a strong trend starts to lose momentum, it opens the door to a reversal and the past rallies all depict that on this 15 min. chart.


 To break it down even more, here's a 5 min chart.


 This is an Intraday Momentum Index showing several smaller negative divergences turning smaller rallies down, and currently a longer negative divergence on this rally-15 min.


 This is the same, but 30 mins and shows negative and positive divergence, still we have one of the most negative divergences now since the Late July breakdown in the market pictured to the left.


 This is the hourly version showing the same history, and again, and even sharper negative divergence then the one seen before the NASDAQ 100 dropped over 15%.


 This is the intraday MCO/McClellan Oscillator on intraday timeframes. This is a 30 min chart showing the positive divergence that started this rally as well as 2 negative divergences.


 This is the 60 min version, also showing the positive divergence starting this last rally and the negative divergence.


 This is the daily MCO.


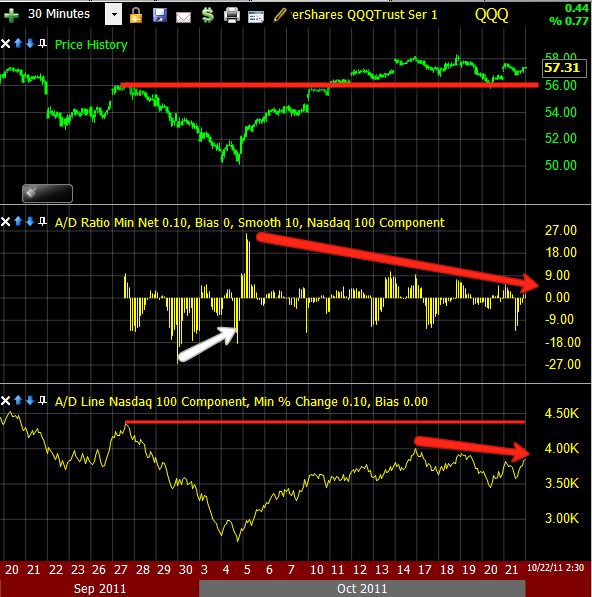
 Here are the Advance decline line and advance decline ratio for the NASDAQ 100 on a 30 min scale.
You can see both are not keeping up with the NASDAQ 100, so breadth is getting thin.


There are dozens upon dozens of charts I could list, but I just wanted to touch on several different area and not overwhelm you. This last chart is of the SPY continuous trade which includes pre-market and After Hours trade. This is a 4 hour time frame and did and excellent job calling the top just before the major decline. We are seeing a similar divergence right now, similar in depth and duration.


I'll probably send out a few more updates this weekend. After all, this is a big news weekend with the EU finance ministers meeting to hammer out some sort of deal to keep the EU from imploding.


Initial reports seem to indicate that the meeting is not so much productive as overwhelming. 


Here are some quote from the meeting:


From the TeleGraph,


"It was grim. The worst mood I have ever seen, a complete mess," said one eurozone finance minister.


This one is harder to understand as it went through Google Translate, but seems to show surprise at the Greek situation and it being so bad that even in the best case scenario in which they privatize assets and carry out reforms, the EFSF is not big enough to cope with anything more then Greece, apparently shocked at what the inspectors found to be the real burden of debt. Good luck, let me know if you arrive at a different conclusion.


The numbers that the Troika on Friday evening on the debt situation in Greece is presented, have altered the agenda of the Euro-Finance completely. Really wanted the department heads to advise [if] they need to convince the country's private creditors to agree on a bigger discount on the bonds held by them, than the previously planned 21 percent.

But the "if" was suddenly a "how high?". Because the inspectors of the Greek lender describe in their "debt sustainability report," a scenario that far surpasses any fears. The country needs even under "normal" conditions, so if everything goes as planned with the reforming and saving, at least 252 billion euros , by 2020 to get back on its feet.

If the economy collapses further, state enterprises can not be privatized as hoped, nor do the reforms [produce the] € 444 billion needed to [please] the inspectors. So it is suddenly clear: the euro rescue fund EFSF is hardly sufficient for more countries to save, and his successor, the latest from 2013 operational ESM also not good.


The Swedish Finance Minister said,

"It is clear that a substantial cut in debt in necessary"

I can only assume they are talking about a Greek bond holder hair cut of more then 21% which should trigger a credit event and cause massive damage to banks who have been writing Credit Default Swaps.

Taling about Greece:


Jan Kees de Jager, the Dutch finance minister, told colleagues: "We've got to get real. People are talking about new defences but with one gulp the whole €440 billion could be gone, leaving the eurozone with no protection at all."


And from Schaeuble you get a feel for the tone and animosity, of course the German at this point nearly bear the brunt of the entire crisis, at least they have the biggest cross to bear here.


According to insiders, Wolfgang Schaeuble, Germany's finance minister, could not resist taking an "I told you so" approach - he had been, after all, the first to call for an "orderly" default for Greece 18 months ago, at a time when the cost of such a move was less than one third of the price today.
"Schaeuble is a man who does not mince his words, whose reputation for harshness and arrogance is well earned. He was, frankly, unbearable," said one diplomat.

More on the atmosphere:


Francois Baroin, the young and inexperienced French finance minister,
attempted to hit back, 
complaining that the IMF's default medicine would hit
France the hardest
; the country's banks are highly exposed and could
threaten its "untouchable" AAA rating.

But Mrs Lagarde, who had held his post until taking up the IMF job this
summer,
 "shut him up" by brandishing the report and pointing to it
its detailed figures. "She really slapped him down
 - and in perfect
English too, a language he cannot speak," said a diplomat.


"Their shouting could be heard down the corridor in the concert hall where an orchestra was about to play the EU's anthem, Ode to Joy," said an incredulous EU official.


And as to the French/ German alliance that was the Core until very recently when France became the target of bond vigilantes (the same way Greece, Ireland, Portugal, Spain and Italy started) here is what the English Chancellor had to say:


Finance ministers - including George Osborne, the Chancellor - expressed frustration on Saturday that their emergency meeting could take no decisions of substance until Mrs Merkel and Mr Sarkozy had buried the hatchet.

"This Ecofin meeting has been reduced to an academic seminar, an exercise with absolutely no purpose," complained one finance minister.

Friday, October 21, 2011

Closing Wrap

I've been putting together breadth chats for a post, but I think I'll save that for this weekend and instead focus on today.

However I do want to touch on some issues related to options expiration week, this data is from the SEC and CME and should be thought of as generalities, but I think it may have some relevance on trading this week.

As a rule of thumb stocks are more bullish during op-ex week and generally don't do as well the following week. A study found the correlation to average a 1% return the week of options expiration and a .04% return the next week, so there is a trend of over performance op-ex week and under performance the following week. To exacerbate this, stocks will generally under perform during bull markets during op-ex week and out perform during bear markets.

Another rule of thumb is 2 days before op-ex Friday, the market under performs and we saw a down day Wednesday this week.

Generally op-ex week is directionally neutral, that's pretty much what we saw this week- from Monday's open until Thursday's close (excluding op-ex day-Friday) the return for the S&P-500 was at a slight loss of about -.75% so as you can see, until Op-Ex Friday, the market was basically flat.

Op-Ex Friday experiences increased volume and generally volatility especially the last hour as traders unwind hedges and if traders exercise options, they often are going to buy those stocks. This last hour of increased volume, also causes institutional money to become more active as volume and/or demand/supply is what they need to get the prices they want. Keep all of this in mind as we look at the following charts.


 Here's the ES futures on a 1 min scale. They were lifted overnight creating this mornings gap because the European bond market was seeing increased yields because of the fear of contagion and worries over this weekends Finance ministers meeting. The European Central Bank stepped in to the bond market for a 4th day in a row starting around 4 a.m. EDT and started buying Italian bonds to halt the slide and increased yields. This is what set ES futures on fire before the open and caused our gap up. Remember what I said about volume in the last hour and note as well the volume early today, also note the 3C negative divergences in the morning which pared the gains of the day in half by the afternoon and more distribution in 3C on rising volume and stock prices during the last hour. This is exactly the kind of environment Smart Money uses to distribute, whether it be selling or short selling. The first divergence played out, the second (all things being equal-we do have a major announcement this weekend out of the EU) should cause downside early next week.

In fact I've been researching and paying attention to how much each pip in the Euro effects the market and what I've come up with is 1 pip= about 2 Dow Jones 30 points. I mentioned, as you will see later in this post, "it seems like someone is trying to hold the market up". The rally that started around 2 p.m. to the lose, broke down like this. From 2-3 p.m. there was a 37 pip move in the Euro, that should equal 74 Dow points, the actual number was 64, but lose enough. The last hour (which I made the comment during) saw a 33 pip move which should have lifted the Dow by 66 points, this time it lifted it by only 44 points. As mentioned, I felt the market was under pressure to be lifted although you wouldn't think that by price, but later the Tick hart will show you what I mean.


 Here's after hours activity for the SPY, considering today was a Technical breakout and there was a lot of momentum in to the close, I find it strange the SPY in the thin AH market could only manage a .10% gain (as of this capture around 6:30), however as you an see, there was a negative divergence in effect during the after hours session. Again, whether it was because of a pin or something else, the last 2 hours of market action seemed forced. Again with that type of momentum going into the close, the very thin after hours market should have been on fire-the final close was +.20% with an even deeper negative divergence.

 This is continuous SPY trade (including premarket and after hours) on the SPY-4 hour timeframe. The divergence right now is similar to the divergence that sent the market much lower.

 This is the weekly continuous trade in the SPY. Note the previous times we had the2009/ 2010 consolidations leading to the next leg up, when that leg started, 3C was moving up compared to now it's not only moving down, but leading negative.

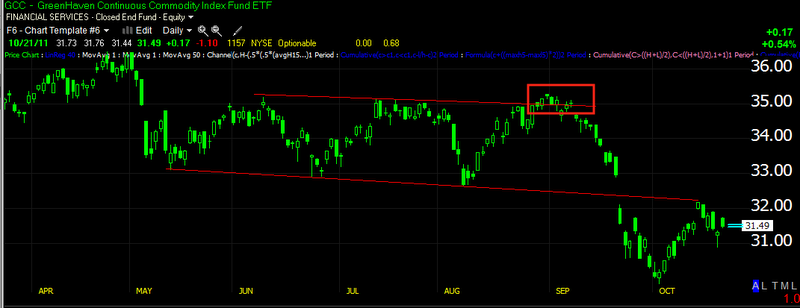
 I posted a chart last weekend that looked almost exactly like this and asked whether the market was going to follow the same pattern as the CCI (Continuous Commodities Index)? We'll come back to this, but considering that volume is normally heavy on a day like today, volume should be nearly double on a breakout, instead volume came in lower and although the gap added most of the gain from the ES futures, the actual candle today is quite small, contrast today's price candle to each of the candles that started a new move up within the consolidation, those candles are 2-3 times the size of today's and this on a technical breakout?

 This shows the volume pattern in the market today (1 min scale)

 As seen in ES, 3C on the SPY also showed signs of distribution into both higher volume environments. As I always remind you, for institutional money to sell/sell short, they need demand and volume to enter their large positions. I find it interesting that there was distribution at both areas.

 It is clearly evident in the IWM as well

 And the DIA, which ended the day leading negative.

 The clean trend from 2-3 p.m. can be seen in a clear channel in the TICK index, the mess at 3 p.m. s what caused me to think there was something going on in the last hour as the TICK oscillated between -1000 and +1250.

 Back to the pattern  mentioned earlier in commodities or the CCI which I posted last weekend, it looks very similar to what we see in the market today, after the head fake false breakout, CC fell 14% and it trades at a beta of about half of the SPY. Also note the daily signal on my Demark inspired custom indicator gave a daily sell signal.

Here in the SPY we have the exact same pattern on a shorter time frame and today, for the first time since early August, we had a daily sell signal on my custom indicator, only the second signal seen in this indicator since the start of August.

I'll bring you the breadth posts this weekend. Have a great weekend.

Quick Update

Something isn't passing the smell test, normally on Friday's traders reduce risk, with the EU summit and all of the problems, you'd think they would be fleeing by the truckload, maybe they are?

 Just a reminder of the Commodity hart-CCI which about a month ago, looked eerily similar to where we are now.

 ES looks like the underlying activity has been distributing all day, including this last move up in the afternoon and on much heavier volume.

 Here's the Q's on this latest move, that chart changed pretty quickly toward the end of day when the big boys come out to play in the market.

 SPY is showing some unusual volume spikes as well since 3 p.m.-last hour of trade is always the most telling.

 SPY 2 min

And the TICK chart, it's almost as if price is being propped up right where it is.

Update

In one of the last market posts  showed you a 1 min positive divergence which led to  bounce with in the intraday move down that started. t's hard to say for sure yet as it's still early, but here are the charts as I know a lot of you have day trades.

 IWM 1 min

 IWM 2 min

 QQQ 1 min

 QQQ 2 min

 SPY 1 min -pretty much in line

 SPY 2 min-slight negative.

The ES chart probably has the strongest signal of all of them.

This could produce a reversal, consolidation or a bigger positive divergence, however I view it as a reaction to support that was broken and lingering in the area is pretty common. I don't think the chances are high that it builds a bigger positive divergence.

EURO/FXE UPDATE

Since this tends to be one of the most influential movers of the market, we should take a look at the Euro via FxE the Euro Trust.

 FXE 1 min -confirmation on the open with an early negative divergence and FXE has been sliding since. Just recently there's a 1 min positive divergence , that move is playing out now.


 FXE 1 min went negative today and then quickly leading negative, the recent positive divergence can be seen here too.

 The 5 min chart has been leading negative, in to higher prices today I highlighted just today's 3C underlying action.

Also the 15 min chart put in a big leading negative divergence-again I only highlighted today's action.

 The longer term trend 30 min chart is actually a bit leading negative, but the relative negative divergence is plain to see.

Here's the longer term 60 min in a leading negative divergence that is close to making new lows while price is near new highs for the consolidation. This is a pretty extreme negative divergence.


Market Update

With that last support zone taken out, watch for some intraday support in the area.

 The Euro is at a support area

The SPY just broke one, but it's common for volatility around these levels and there's a 1 min positive divegene

TICK Chart

The NYSE TICK chart shows how many NYSE components ticked up on the last trade minus how many ticked down. Typically a strong uptrend will see +1000 tick readings and even +1250-1500.

On the downside, the numbers are about the same -1000 to -1500 (1250-1500 in either case is an extreme).

Here's today's action, note the downtrend and a lot of activity below zero and in to the -1250 area.