Tuesday, December 27, 2011

RIMM Update

As you know, I have held my RIMM calls since earnings disappointed because there has been a strong leading positive divergence in the 15 min 3C chart, sure enough, RIMM bounced back or is at least bouncing back.

 RIMM has now retraced more then 62% of the gap from earnings, the 62% level is in white, the 100% level is in green.

 You can see by the trend line that RIMM is close to filling the gap, volume has been low, but this early thus far, it looks like volume is on track to be higher then the last several days, often accumulation occurs in flat price ranges on low volume, unlike what many technical analysts think about volume spikes. Think about it, why would smart money announce to the world they were buying and drive costs up against their accumulated position while they are still filling it out?

 RIMM is looking a little parabolic right now and a pullback would be healthy for the stock.

 You can see on the 5 min 3C chart the accumulation in the flat trading range that had low volume, we also have a leading positive divergence now as well.

 The 15 min chart is what kept me in the trade despite a sizable gap down after earnings, however now we are seeing the 30 min chart move in line which is positive as the strength from short term charts is bleeding in to longer term charts.

 The 60 min chart has a huge positive relative divergence and is now leading positive, a huge improvement as RIMM has largely been off on its own ignoring the market in many ways. It seems something may be going on there.

 The 60 min Trend Channel has tracked the downtrend, it is now long and holding the uptrend including consolidations, ADX below turned down from above 40 signaling the end of the downtrend and is now moving up signaling a stronger uptrend.

Look at RIMM compared to AAPL, and AAPL is the stock that would be used to manipulate the NASDAQ 100/QQQ higher because of its weight. For now, I'll keep holding RIMM, a pullback would be nice to wring out any overbought excesses on an intraday basis.

Some surprising moves in Credit

We follow credit and other risk assets to judge the viability f a rally and in other cases, to tell us when a rally is coming before the market shows us or as confirmation. The credit markets are much, much bigger then the stock market, therefore credit often leads and the stock market eventually follows. We look for disconnects between credit and broad risk assets like commodities (which should all rally together with stocks in a healthy rally) and the S&P-500 to tell us when a rally or bounce isn't as strong as price would make it appear, this disconnect can often be used to short stocks on strength to get better positioning as stocks almost always revert to the mean of credit/risk assets.

 Commodities are selling off a bit this morning...

 Long term you can see commodities leading the market in the white box, in the red box they are lagging the market badly, this is a disconnect between risk assets (commodities and stocks).

 High Yield Credit is also selling off this morning.

 Longer term you can see what the disconnects between High Yield Credit and the S&P produce, quick moves down. Right now there's a pretty severe disconnect in credit.

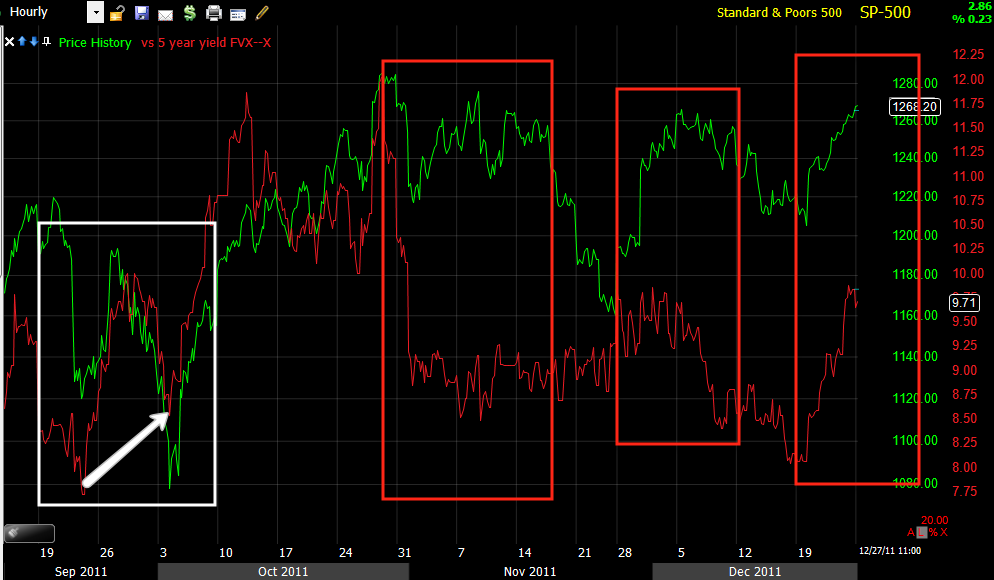
Yields/Rates act like a magnet for stocks, here we also see yields taking a plunge. It seems something is going on in the risk markets that is not yet reflected in the equities market, of course equities are in the period of Q4/Year end window dressing until tomorrow.

 Longer term you can see how yields predicted the October rally with yields making a higher high while equities were still making lower lows. There have been several dislocations since then, each has had a sharp move proceed it, currently there is a bad dislocation as well.

 The Euro was largely in lock step with the market this morning as it should be, but has shown a little relative weakness recently.

 Longer term the relationship between the Euro and Stocks has predicted the late July fall in equities, the early August bounce and now s severely dislocated from equities.

 Most surprising is the sell-off in High Yield Corporates today versus the S&P, this is quite a move for this type of credit.

 Financial momentum is still lagging relative to the market on an intraday scale.

Long term financial momentum predicted the rally in white by making higher highs while the market was still selling off, there have been several bearish dislocations that have led to quick sell offs, there remains a dislocation presently.

CONTEXT is not as detailed as our risk models, it is an amalgamation of credit and other risk assets in to a single model, right now the ES futures 9S&P E-mini) are dislocated and much more bullish then risk assets in the CONTEXT model, this is not bullish for the market, the model confirming ES would be bullish for the market.

 ES much higher then the Model suggests it should be. Below is the extent of the difference between what the models predict ES should be at based on other risk assets and where the two actually are, when it is in the red it is bearish, when it is in the green, the model is higher then ES.


Again, it seems that the credit markets better understand the dynamics of situations like the ECB deposit facility and the broken hopes of the ECB's LTRO program much better then common equity trades and there are behind the scenes moves in credit reflecting a risky market environment.

AAPL Update

AAPL is one I've been patient with and have urged patience, not to jump in on the short side too early. AAPL is showing a true short squeeze this morning, note the lack of pullbacks.

 This morning's short squeeze....

15 min negtive and a parabolic spike, just be patient and let it come to you.

Small Caps are the Problem

As pointed out last night in my video, for a Santa Rally, the Russell and NASDAQ 100 should be leading, take a look at the opening.

 The Dow is up +.24%, but look at the Russell 2k...

 In the red, this shows a defensive market and late last week I said over and over, "Don't forget about TZA" which is in the green this morning with EDZ as well.


I was trying to make the point last night that small caps need to lead the rally, not defensive large caps.

China's Shanghai Composite near 2011 lows

 Year to date

 3 month, near last support before new lows

1 day trade.

Overnight Trade

The Asian markets are unsettled, there has been some upside pressure on the Euro as I showed you, interestingly, commodities (oil, silver, copper and gold) were all under pressure. To be fair gold was under pressure because of price stability curbs the PBoC in China put in place overnight.

Italian 10 year BTPs which closed Friday at 6.98% are back above the 7% mark.

As for the European Central Bank's faux QE, the LTRO (Long Term Repo Operation) in which they took any "A" rated or better collateral (the better collateral the banks surely held to use in private financing, sticking the ECB with their dirtiest laundry) and lent (net) over $220 billion Euros for 3 years, which the banks where theoretically supposed to use to finance a carry trade in which they took the 1% money and bought 6 or 7% yielding BTPs and other sovereign debt, as we saw last week already was showing signs of being an abysmal failure as banks redeposited the money with the ECB for safe keeping and BTPs which should have moved down because of the theoretical buying, actually moved up.

Last week, a day after the LTRO was conducted, the ECB saw a 2011 record usage of their deposit facility, the banks put the money there for safe keeping as no on trusts anyone as far as any kind of lending of private broker repo / bank activity as there is a freeze in liquidity in the traditional cash markets as well as the repo-reverse repo shadow banking system.

Last week the ECB saw $82 billion Eur deposited after the LTO bringing the facility to a 2011 record of $347 billion, but think about how much of that came in 1 day after the LTRO-$82 billion! I don't think it was any coincidence.

Well today, overnight the ECB has set a new record in its deposit facility usage as banks deposited another $65 billion overnight to bring the facility's usage to an ALL TIME NEW RCORD HIGH of $412 billion Euros.

remember last week we saw something very similar when the US Treasury auctioned off 4 week debt and had 9 times more bidders then paper for sale, the interest rate the paper yielded was a big fat, exact 0.00%, so US banks and others were willing to take an absolute return of 0% just to safely park money at the Treasury, and even worse, whatever they are afraid of, this was a 4 week auction, meaning they are very afraid to have their money in banks or other institutions over the next 4 weeks, so much so they are willing to have 4 weeks of opportunity cost and make 0% for it.

The KICKER in Europe is the banks borrowed the money at 1% and earn only .25% in parking it at the ECB's Deposit facility, so in the US banks are willing to earn ZERO on their money, in Europe, they are willing to PAY .75% to keep it SAFE!! And there aren't problems in the banking system MUCH bigger then we comprehend (sarcasm)?

I think we can officially conclude that Sarkozy's dream that the LTRO would be used to buy sovereign debt is now a nightmare as the money goes out of the ECB to banks and then comes right back in as they are terrified of using it for any other purpose then increase their capital ratios.

In signs of further trouble, the German 1 year Bund has dropped to levels BELOW ZERO. When this last happened was in late November, just before the coordinated Central Bank action to provide liquidity (as speculation was 1 or more major banks was on the verge of failure).

As far as earnings news, Sears (SHLD) pre-announced and is getting slaughtered, down over 19% this morning on Q4 results.  The results reflect what has been thought the entire time about the holiday season, retailers were dumping in volume on ultra thin or non existent margins. This will lead Sears to close 120 K-Mart and Sears stores.

Updates are coming, I want to give the market another 30 mins. to settle in. If you didn't already, please check out the 10 min video posted last night below.

FX EUR/USD Descending Triangle

Of course in technical analysis dogma a descending triangle is supposed to break down, but in the real worls we see these head fakes 80-85% of the time on obvious patterns and as I said last night (after 3 smaller triangles head faked 3 consecutive days in a row in the FX pair), this one would too, probably very early in the morning. It turns out it did so around midnight EDT.

So there's the start of the breakout, I finally have some better trendlines.

Monday, December 26, 2011

EUR/USD

Last week we saw 3 consecutive smaller triangles in the EUR/USD, all showed (predictably) false upside breakouts that went on to fail. The series of smaller triangles has now formed a bearish continuation Descending Triangle. My thoughts are this too will show a false breakout, but the implications of the triangle are more serious as they effect the trend.


Here are my horrible trendlines again, but a descending triangle is found exactly where this one is, after a downtrend and is a continuation pattern (bearish implications). I would think just like the last 3 FX triangles last week we will see an upside false breakout and then as I have suspected since before the FX bounce started when the $1.30 level was first broken, the end of the bounce allowing the substantial $1.30 longs to liquidate their positions using the bounce from sub $1.30 levels.

Remember the Euro and the market have roughly the same correlation, so a drop in the Euro would be a market negative event.

Earlier as I pointed out in the video tonight, December hasn't been as solid a month as we usually see in a Santa Claus rally and most troubling is the defensive nature of the market with the Dow being the best performer (internals as well). Small Caps should lead a move like this and the R2k just isn't acting well.

In any case, most of Wall Street won't be back until after the New Year so volume will be very light which has the potential of setting up some big swings (as we saw the market levitated on no news, no real divergences-on Friday afternoon-it was hard to take that move seriously after the rangebound market most of the afternoon, an easy to spot manipulation of the market in a light volume environment) , news could also play an important role as there are few financial releases of any importance. Most of the potentially bad stuff that may arise out of Europe will start mid-week through Friday.

As for the triangle above, I'm guessing that it breaks out sometime in the wee hours of the a.m., possibly on the European open. The price pattern implied target would take the Euro back below the psychologically and technically important $1.30 level. Should this happen, this will further exacerbate the strength in the dollar and may make for a quick short trade in gold which has been performing nearly exactly inversely to the dollar index.

A quick 1-2 day trade in DZZ may make for a little extra spending cash while the longer term position in gold would be severely degraded.


Small Caps and the Russell 2000 are lagging while the Dow-30 is leading, a more defensive posture in the market. Take a look at some of the metrics comparing the 2010 Santa Rally period vs now.


Saturday, December 24, 2011

Anna and I Wish you All Happy Holiday Season and Fantastic New Year!

All of our best to each and every one of you!