Wednesday, February 15, 2012

UNG Update

UNG is another we have been watching and seen a recent change in character. As a matter of fact, when I was checking on the top 25/top 150 percentage gainers (1 day) for the Cats and Dogs trades, UNG had popped up several days in the top performing stocks as well as the top performing ETFs. Even more encouraging, it had done so on days when the market was down, thus showing it was able to trade up and as a best performer without needing market support.

 UNG is now in a triangle pattern, it's not so big that it can be ruled out as a continuation pattern yet, however, volume suggests that there's something more going on here then a consolidation which is typically on lower volume, especially in a bear market trend when low volume is a hallmark of a bear market. The next chart will give you some perspective on volume.

Recent volume is the highest ever, suggesting UNG has seen a capitulation event and thus the triangle is something other then a consolidation/continuation pattern.

 The daily Bollinger Bands, as you would expect with a developed triangle, are starting to narrow, implying a highly directional move. Again, just like with URRE, I would caution against expecting a "V" reversal, as such, any directional move should be put in its proper context, in my opinion that would mean the move has less importance then the triangle and any subsequent directional move would suggest.

 MoneyStream on a daily chart is also showing positive divergences, indicating accumulation. MS is calculated completely differently then 3C, they share almost nothing in common, yet they are both money flow indicators and both giving the same positive signal.

 This Triangle in my opinion is VERY obvious and too small to be a mature base. I would expect any directional move out of it either up or down to be a head fake move, we may be able to take advantage of it on a short term trade basis, which ever way it breaks. In my opinion, the most likely longer term outcome is a reversion to the mean if such directional move occurs and a bias toward further basing.

 The ATR in UNG is exactly the opposite of what I showed you several days back for the market averages which have seen averages such as: Dow-30, the S&P-500, the NASDAQ COMPOSITE, the NASDAQ 100, the Russell 2000 and mid caps, just to name a few, all see their ATR since the late December rally started, fall by 40 to over 50% even as prices are higher. The same thing happened during the Spring 2008 bear market rally. A healthy move should see the ATR at least stay within its normal range if not increase like we see here, it certainly shouldn't drop by more then 50%.

 Here's the daily Trend Channel hold a swing move (a bit longer actually), it stopped out at the red arrow, but again there were earlier warnings such as the Harmi in the yellow box and the fact that it occurred several standard deviations below the average price (oversold and flashing a reversal signal).

The 2-day Trend Channel has held a much longer downtrend and is actually still in effect, so it does not make for a useful stop for a long trade, but may prove useful on any trend up, here we see about 9 months of trend held in the channel.


 Ultimately the 3-day stop is the best, it held the entire downtrend here as well as a 2 year down trend mentioned in the caption of this chart.

 The hourly 3C positive divergence...

A 15 min positive divergence around the area of the triangle, so we may see a directional move up, it can be traded, but remember, a base is more likely before any sustained move.

Right now a stop for UNG is very hard to determine, lets let it play out a bit. If you want to take a long trade on a possible breakout, I would take it as soon as UNG passes $5.46, even intraday, you can set an initial stop at 5.36 or so, but then we'll want a trailing stop and pretty tight. In the case of a downside directional move, the same rules of entry apply, I would watch the $5.08 area. I would probably consider an initial stop around $5.20, although this is open to a lot of interpretation. A tight trailing stop would also be my preference. Either way, I think the most likely outcome is a directional head fake move followed by a return to the area to continue building some sort of base.

URRE Update

URRE is one of those stocks I mentioned yesterday that I only see a handful of each year, the stocks that have long term divergences (in this case a positive divergence) that contradict price and eventually, end up moving well above when the divergence first started and we have been tracking it for a while and as you know, recently noticed a positive change in its trading. I mentioned a few examples yesterday like the 2008 top in oil which was negative for several months on the longer term charts as it headed 20% or so higher, then gave up over 80%. The $US Dollar Index did it twice  in both the 2008/2009 period and 2010 as well as a number of individual stocks and to a lesser degree some of the C&D trades. One of the most notorious was HOV during the 2000 tech bear market which saw a year of accumulation. As Jesse Livermore said, it was his sitting on his hands that made him money, being right and having the courage of your convictions. HOV went on (and after the tech market, who would have guessed housing would lead the next bull market? Smart money knew) to gain over 2500% over the next 5 years.

 Today URRE is doing decent with around a 5% gain, however this isn't what we are looking for with this trade. It does look like URRE has been correcting/consolidating over the last 4-5 days. Remember, stocks don't have to pullback to consolidate, they can do it through price or through time; volume would suggest URRE has been consolidating through time.

 As a general concept that I have been pointing out for more then a year, a bullish descending wedge and to a lesser degree, bearish ascending wedges, no longer act like what you will see in Technical Analysis textbook patterns. This is just another example of Wall Street evolving and using Technical Analysis against technical traders who still haven't adapted (which I have pointed out numerous times, makes technical traders predictable and thus Wall Street's actions/reactions more predictable). TA textbooks will often show a descending wedge reaching its apex and then breaking out and promptly retracing the base (in this case around $3.60). However that is not what we see in the real world anymore, now we see a false breakout setting up longs as you can see in the yellow box, a head fake move, followed by a period of usually lateral trade or some sort of base. URRE has been forming more of a "U" shaped base, the days of "V" shaped reversals are pretty much gone.

 When I first noticed a change in character in URRE I tried to anchor expectations and said, "I would like to see URRE form a rounding base" (this was before the rounding part of the base started to turn upwards so thus far we have seen what I hoped to see). In December URRE started to make a move to the upside, although ultimately as it is a long position, that is what I want to see, I was a bit concerned it was getting ahead of itself so the pullback was not a bad thing in my view and I asked you to keep your eye on the 22 day moving average and look at the bigger picture rather then the day to day trade. So long as the 22-day continues to round, I am fine with URRE's trade. The pullback from the December move up actually gave the 22 day a better looking rounding pattern.

 Looking at a 4-day chart better shows the pattern as well as volume-this is what I was hoping to see.

 Here's my Trend Channel set to 3 days, which is the stop I prefer; it held the last move of 800% and captured the bulk of the trend. Although the stop out came at the first red arrow to the left as URRE closed below the highest point of the lower Channel line, there were warnings before that such as the long upper wicks on the candlesticks in the red box, showing resistance and higher prices being rejected, in the yellow box URRE made a lower high, so there were clues and the exit in URRE could have been before the Trend Channel stop out thus retaining more of the gains. The Trend Channel also held the downtrend perfectly, stopping out at the red arrow, but again we had hints before then such as the descending wedge reaching it's apex, 3C accumulation, etc.

 As you know, I prefer wide initial stops, they can always be tightened later, I would continue to use the 3-day Trend Channel with a current stop ON A CLOSING BASIS of $.81. The trade needs time to work, once a trend is under way, the stop can be adjusted, but I'd rather take on fewer shares for a wider stop then more shares on a tight stop that is likely to get hit. Besides, you can always add to the trade, averaging up on a winning trade is a winner's strategy.

 The daily positive divergence right now is stronger then the last two, the last run produced returns of over 800%.

Here the 60 min chart shows accumulation at the October lows and a current leading positive status.

Although it's nice to see URRE with a decent gain on a day like today, the premise of the trade is much larger. I'm looking for at least a run to $3.60 and given the size of the daily accumulation, I wouldn't be surprised to see much more then that. Just be patient, keep an eye on the rounding base, watch for signs of stage 2 mark up such as a strong breakout from obvious resistance on huge volume to alert the momentum traders who are running volume surge scans all day.

Iran Cut or Did not Cut Oil Exports to 6 European Countries?

I haven't seen a market so driven by "persistent" rumors since 2008; what I mean in underscoring persistent is other then the "QE3" rumors we here anytime the F_O_M_C meets or a F_E_D speaker is set to, well... speak.

Earlier today the news was that Iran had cut oil exports to 6 EU countries: the Netherlands, Spain, Italy, France, Greece and Portugal in retaliation for EU sanctions according to Reuters.

Although I'm not sure when the story first broke, it seems to have been around 7 a.m. this morning. Here's a chart of CL (Crude Futures).


As per usual, it didn't take long for the story to be denied...


Iran's Oil Ministry denies cutting oil exports to EU


" Iran's Oil Ministry denied state media reports on the Islamic state stopping its crude exports to six European countries on Wednesday, February 15, Reuters reported.
"We deny this report ... If such a decision is made, it will be announced by Iran's Supreme National Security Council," a spokesman for the ministry told Reuters."

As for USO, since yesterday's update it doesn't appear much has changed.

 USO remains above the downtrend channel, which as I mentioned yesterday was extremely obvious and bound to be shaken out sooner or later, especially in a market this size-everyone can see such an obvious pattern. The Algo induced move earlier this week, I suspect had something to do with it as NANEX has confirmed the presence of algos operating on that quick move up. While we don't know what their intension was, I would guess it probably had something to do with shaking out this channel as the dogma of Technical Analysis would cause most traders to stop out on such a break. I of course view it a bit differently as the market has evolved since the dogmatic views of Technical Analysis were enshrined nearly a century ago. You have to keep up with the changes in the market and technical traders still haven't adjusted to changes that are now over a decade old.

 If you click on this chart, hopefully the 2-day Trend Channel (which is what I proposed as a stop on a short trade) is still holding at this point. Remember, all stops with the Trend Channel are on a closing basis unless otherwise noted. To the left you can see the uptrend's stop out at the red arrow and while there were some additional gains, I hardly think they were worth it after the Channel issued a sell signal as there was a lot of opportunity cost there. The white arrow points out the approximate area of the current stop.

 This short term 1 min 3C chart shows some small accumulation at yesterday's lows, after there was distribution on the open sending USO lower in what has recently become a trend of fading early strength. I would suspect if there was inside information about the Iranian news, we would have seen much stronger accumulation, in the yellow box there is none, only at 1 p.m. and on a 1 min chart. There's a current negative divergence this morning.

 The next timeframe (the longer time frame, the more important to the longer term trends, although this is still intraday to several days), the 2 min chart, shows the negative divergence (distribution) on yesterday's gap up open, sending USO lower to the 1 p.m. intraday lows where we saw 1 min accumulation; note the accumulation at the lows was not strong enough to bleed in to the 2 min chart. We have a current negative divergence from yesterday's late afternoon trade through present as USO has lost momentum over the last 3 days and last 2 especially.

 The 5 min chart also shows no accumulation at the 1 p.m. lows yesterday so the only accumulation was on a 1 min timeframe, which would be in preparation for an intraday move higher (the timeframe typically associated with market makers/specialists and more recently HFTs which are front running the traditional middle men; stocking up in preparation to sell in to intraday strength). There remains a relative negative divergence on this chart.

The daily chart shows the 4 stage cycle I often mention, 1) accumulation at the October lows at the white area, 2) Mark up in which 3C is in sync and confirming USO's move higher, 3) Distribution (at the red arrow) which started well in advance of the channel moving down in the yellow timeframe area and in a flat area which is where we most commonly see smart money moves, whether buying or selling. Stage 4 is decline, so we are somewhere between late stage 3 and early stage 4 and this despite the Israeli Embassy bombings yesterday and the general geo-political tone in the Middle East especially as it pertains to Iran.

I'll keep an eye on USO for any further developments.


Overnight

First lets start with yesterday's close, something was certainly up after the market had held all day below the traders favorite intraday moving average right up until the closing action...
If you don't already know what caused this bout of buying, it was the Sewing Circle once again...

Reuters reported that of all people, Greek Conservative party leader, Samaras (the same who said the terms of the bailout would be renegotiated after April elections the day after voting for the terms and truly upsetting the Troika in delivering their "Sum of all Fears", that Greece once again would not do as they pledged) was to deliver a letter commitment, presumably the same letter of commitment that the Troika didn't receive and therefore cancelled today's Finance Minister's meeting. That was it, that was the news that sent the market higher in to the close... As for the rumor, true to the EU Sewing Circle rumor machine.


Overnight though, the sewing circle didn't end...

Overnight ES had its own pop, this time the same old rumor that has been floating around since before the EU decided to leverage the EFSF, which also sent the market higher only to see that plan fail miserably. The story?


"The head of China's $410 billion sovereign wealth fund CIC brushed aside a call by German Chancellor Angela Merkel to buy European government debt, saying such investments were "difficult" for long-term investors.

In comments ahead of a China-EU summit starting on Tuesday, Lou Jiwei, chairman of China Investment Corp (CIC), said any fresh injection of funds into Europe would be in industrial and other real assets, not government bonds."


Then this morning...


GREEK CONSERVATIVE PARTY SAYS POLICY MODIFICATIONS "MIGHT BE REQUIRED" FOR IMPLEMENTATION 


This latest news is precisely what sent ES down from its overnight highs around 7:40 a.m., this was promptly followed up be news from the German Finance Minister minutes later, that despite reports the 
Greek letter had been sent, WITH SAMARAS'S SIGNATURE!


Next up in pre-market...


SCHAUBLE: SO FAR THE NECESSARY DOCUMENTS FROM GREECE ARE NOT PRESENT


The Euro's reaction?
 As usual as the sewing circle rumors, I mean news, see their half life decline with each passing week.

However, it doesn't stop there, minutes later in premarket:

EURO ZONE FINANCE OFFICIALS CONSIDERING PROPOSAL TO DELAY ALL OR PART OF GREEK BAILOUT YET STILL AVOID DEFAULT

This put the Euro at fresh lows on the week.


As of right now, ES has retraced nearly all of the post China Rumor story...

And so we move forward from here. I would recommend caution on any news/rumors (especially when they come from unnamed official sources) as these have time and time again sent the market higher only to see it retrace the rumor upon the rumor being refuted, usually in a few hours, but no more then a day.

Tuesday, February 14, 2012

SLV Chart Request...

Gold and Silver and probably 2 of my least favorites issues to analyze, gold is in a potential bubble and silver has been manipulated more then any one single issue I can think of and compared to gold (geologically-as in the ratio of gold vs silver in the ground) silver is way undervalued compared to gold.

First lets start by looking at the long term which is a good place to start when analyzing an issue, you have to know where you are in the trend first.

 This 5-day chart shows an RSI negative divergence at the top, which isn't very strong and a recent RSI positive divergence. The top was the COMEX manipulating silver with 5 consecutive margin hikes even after they killed silver, they kept going. If you click on the chart you should get a larger view, note the candlesticks on this 5 day chart, you probably wouldn't see them on a daily chart' they form a near perfect Doji Star reversal that is confirmed on exceptional volume, but that had a lot to do with the COMEX. Note the trend as well, lower highs and lower lows, but possibly SLV could break that and make a higher high. There would not be a trend in place until it also made a higher low and moved off that low. My best guess by looking at this chart alone is for a bounce and likely resumption of the downtrend.

Looking for correlations, you don't find much. Usually with gold there's either a market correlation depending on monetary policy (QE makes for a good market correlation) or there's a flight to safety inverse correlation. Silver is not as correlated to the $USD as you might think.

 This is the correlation to the Euro/$USD, in red it's useless because of the COMEX hikes, in white it's a bit better and there's a rough correlation to dollar weakness (again, QE produces dollar weakness so in a QE environment, the correlation is better and the PM's benefit).

 As for market correlation, here's the SPX, virtually useless, but I did find one correlation that is predictive and that is valuable.

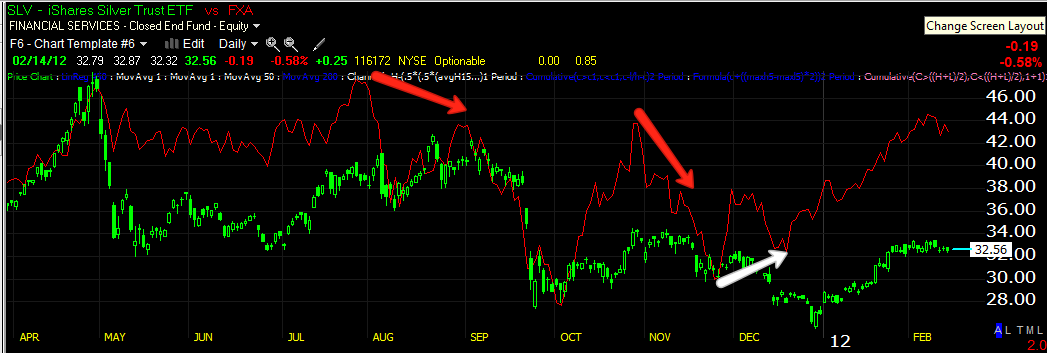
 Here's the Australian dollar or FXA, note the Aussie topped in August, SLV soon followed, it topped again in November, SLV soon followed, it made a higher low in early December, that sent SLV higher, unfortunately there's no divergence to tell us what comes next, but keep this in your bag of tricks for SLV and watch for a move in the Aussie, likely it will tell you where SLV is going next.

The next best thing we can do is look at the Australian dollar and see what 3C says...
 On an hourly chart, the FXA is in trouble, this would suggest that SLV will be in trouble, but there seems to be a 2 week lag between FXA's moves and SLV following.

 Very short term we have a positive 5 min divergence suggesting a FXA bounce, so this may very well bounce SLV a bit.

The 2 min chart shows the same. So based on what I see thus far, it looks like SLV could be in for a bounce and then potentially a dip.

Now to look at 3C/SLV short term and see if we have some confirmation...
 The 10 min chart is showing a positive divergence, it's several days long, that's in the bounce category.

 We have a positive divergence on the 5 min chart too, a couple of days long, so that hint at a bounce.

 And today it put in several positive divergences and some productive price movement, lifting off its intraday lows.

 This area around $34 is where I believe the new JPM line in the sand to be, although I have no idea if they still hold the SLV short and how big it may be.

 So far the Trend Channel has kept this move in the long trade, I would not short SLV until a break below the Trend Channel, just under $32 on a closing basis.

 Longer term on a 2 day chart there is a "possible" small positive divergence, it's hard to say definitively because some other timeframes don't support that view.

 Like this hourly chart, it's clearly negative, but so was the FXA chart in this timeframe.

 The 30 min chart went from confirmation to a negative stance, same as FXA.

The 15 min chart is the same, however, considering resistance at the $34 area, a bounce that breaks it on a head fake move seems reasonable. The move certainly could be traded from the long side, but we would need to check the breakout as I suspect it would be a head fake / shakeout move, but it makes sense with the long term and short term charts, a bounce that breaks $34 followed by a move down, so there are two potential trades, first long and then short.

 Using the swing trading system I have been working on, SLV is still considered a long as the Trend Channel confirms. Using this layout, there are two potential long stops, one at the Trend Channel at $32.22 on a closing basis and the other using the Swing pivot with a closing candle that has a high that is lower then $32.80.

If you wanted a tight stop, the volatility stop I have incorporated in to the swing layout is at $32.46.

My feeling is a bounce above $34 is probable, but it is also probable that it is a head fake move, which may give you good short positioning, trading it up and then down. If you just waited and there was no bounce, a close below the daily Trend Channel would be worth looking at a short trade.

I know there's a lot there, if you have questions, just email me.

The 5 min 50 bar average makes another appearance

Old habits die hard, note the 5 min 50 as resistance all day and the break of it brings the volume.

Market Update

There's very little accumulation on this move, just enough to keep up appearances.

By the way, the Finance Minster's meeting for tomorrow was cancelled, you know who they blamed it on

Junker Junks the Euro

Why Greek party leader, Samaras said what he said about re-negotiating the terms of the bailout after the April election, I can only assume was for political gain. Those words alone were exactly what the Troika fears the most about Greece, that they won't live up to their obligations.

I pointed out last night that tomorrow's meeting of the finance ministers can't possibly produce a bailout agreement because of all the votes in the Netherlands, Germany, etc. How can they summit of FMs produce a vote when the key individual players haven't produced the votes needed to do anything at a summit. As I said last night, all of the votes and timetables for them will make your head spin and to think that these group of clowns will be able to manage a disorderly default of a developed nation!

So the Euro keeps diving as expected..

Juncker's statement didn't help, but it was predictable as I pointed out last night and just summarized.

From the DJ newswire...

Juncker: I did not yet receive the required political assurances from" Greek coalition party leaders "on the implementation of the program


As far as I know, other then rumors of what the Troika may demand as proof, Greece hasn't been presented with specifics to give political assurances, but even if they did, the likely next PM of Greece, who unlike Papademo-ns (in his closet)formerly of Goldman Sachs, will be freely elected-Samaras, said everything the Troika feared when he voted for the austerity measures and the next day said they would be re-negotiated in April (presumably after his election).


So if it's not already clear, the end game is "Kick Greece out of the EU, they serve no purpose for German industrial production any more. All that is left are the details of how, when and how bad.

JPM Changes in Character

 It was just a few days ago I pointed out that JPM put in the first Bearish Engulfing candle since Dec. 6th 2010 a definitive change in character. This is what a normal wedge looks like these days, nothing like what you see in a technical analysis textbook. They head fake, they move laterally, they do everything except what T.A. books teach you as Wall St. uses Technical Analysis against you.

 The 30 min 3C chart of JPM-it' no coincidence that this looks so much like the SPY 30 min chart, even though they are two unrelated equities, heck, one is an ETF! Yet they look the same, that is why 3C stands for "Compare, compare, compare".

 The 5 min chart after the wedge breaks out, exactly what TA says it shouldn't do, which draws in buyers on what they believe is a failed pattern. The Bearish Engulfing candle trapped 4 days of longs itself, today's move traps something closer to 2 weeks of longs at a loss and this is why they run these head fakes.

 A negative divergence on the breakout and subsequent formation of a bearish engulfing candle in white and a leading negative divergence now.

The 2 min chart shows the same, that open that created the bearish engulfing pattern was under distribution since it started and was the highest move since last August.

Yes, I think JPM is a short candidate.