Monday, April 2, 2012

QUICK MARKET UPDATE

 The DIA continues to be negative, but recently it has turned even more so from Friday' already negative action.


 ES/3C intraday makes very good and timely calls on divergences, this entire move in ES has been in a relative negative divergence, now it is starting to lead negative.

 The intraday IWM chart is also starting to lead negative

 The same for the Q's

 And the SPY.

This also makes sense on the NYSE TICK chart (number of NYSE advancing stocks, less the number of declining stocks). The trend in TICK is as it should look with the market, but that trend is starting to show signs of a crack below the trend line.

I'm really trying to be patient in not pulling the trigger to early. To me, just from intraday experience, it would seem too early in the day for the market to reverse and hold those losses through the close.

I'm going to look at some other indicators and charts and see if I can get a better feel for what's going on. This could certainly be an intraday pause.

Patience in AAPL

And this is why patience is key...

 Since the last AAPL update it has added about 4 points, the higher it can move, the less risk in a short position. The divergence was short on Friday, but sharp so this all makes sense.

There's a negative divergence as AAPL moves higher as well as volume and momentum falling off on  the chart above, this is what I want to see when looking to short in to strength. Now to see if we get that same effect of late day market strength after the EU close. Although I'm starting to get an itchy trigger finger here, I will remain patient.

The bounce thus far in the QQQ/IWM is encouraging as it is more along the lines of what I expected, the SPY/DIA are lagging and I meant to post this last night, I wondered if there would be some sector/market average rotation in to the the Q's and R2k as they lagged badly Friday.


GLD/SLV Update

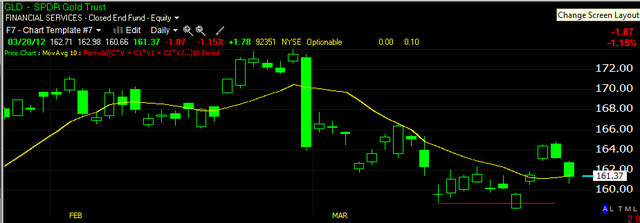
On March 22nd I posted a positive divergence in GLD and SLV as well as the miners, favoring the junior miners, GDXJ. I said at the time, it wasn't a huge positive divergence and there is still the matter of the longer term trend in GLD which is questionable, but I though we may get up to a swing length trade (up to a couple of weeks) out of GLD. GLD pulled back with the market on the 27th last week and on March 28th in this update, I posted I thought the pullback was ending and GLD would start a new leg up.

So far, so good. Here's what I was seeing on March 28th.

 The short term 5 min chart was starting to go positive on 3C.

 Typically on a new move, the first pullback is to the 10-day moving average as a general rule of thumb, on the 28th and 29th, GLD found closing support at the 10-day moving average above.

 The 15 min chart showing the first pullback since I had made the first long call in GLD, was also showing a positive divergence suggesting there was some accumulation in to the pullback, this is what I look for on pullbacks to the 10-day moving average to get a better feel as to whether support will be found there.

The hourly chart actually improved from where the initial long call was made as it remained in a leading positive position through the pullback.

Since then, GLD has moved higher along with SLV, GDX and GDXJ.

Here's what the charts are looking like now as the highs that were attained before the pullback will be the first real test of significant resistance.

 GLD 60 min, the 22nd was a head fake move below support, remember that head fake moves are the last thing we generally see about 80+% of the time before a reversal, GLD reversed after the head fake move that same day, crossing back above resistance. The idea here is a simple shakeout, the market maker or whoever, can grab the shares on the cheap as they have the total order flow book and have a good idea of which way the stock will be heading. It's an easy way for them to stock up on the cheap and add some momentum to the move. The 60 min chart looks pretty good except that 3C is at the reversal highs, which in GLD's case, is ok as price has not reached the same highs yet. Looking at GLD ALONE on this chart, I'd say it looks like it wants to consolidate again and has a decent chance of moving up to support and a pretty good chance of moving through it, but this is the longest intraday chart and takes the longest to react to changes.

 The 30 min chart is in the exact same situation.

 Here's what I don't like, the 15 min chart has been showing a negative divergence since the turnaround on the 29th, I think in my opinion, it's too early to see this kind of divergence on this long on an intraday timeframe, if GLD was at resistance from last week's highs, then maybe, but as it stands, this is something I don't like seeing and need to watch to see if there's deterioration on the next longest timeframe of the 30 min chart.

 The 2 min chart shows this negative divergence as well

 And since the accumulation on the pullback, the 1 min chart, especially today, is showing the same negative divergence. Now this could be a lateral consolidation, prepping for a run at resistance, but the fact it has reached the 15 min chart so quickly is something I don't like.

As for the miners, I'm covering GDXJ which I think looks a little better then GDX (Junior miners vs regular Miners).

 The 60 min chart here has a strong positive divergence , again note the head fake move in the yellow box. The real strength on this chart is the pullback on the 29th saw 3C much higher then the 27th's positive divergence, this is a leading positive, but once again, even though it is leading positive, 3C is stuck at the highs of last week before the pullback. All in all, again, looking at this chart ALONE, I like what I see and there may very well be a bigger accumulation cycle forming in GDXJ and perhaps the PMs as well.

 The 30 min chart looks a lot like GLD's in that it is leading positive, but stuck at the highs of last week, again GDXJ's longer term 30-60 min charts look even better then GLD's.

 The 15 min chart here is less troublesome, it is leading positive through last week's highs, so this needs to be watched to see if the 30 min chart sees this strength bleed in to the 30 min.

 The 2 min chart looks better then GLD's as it showed confirmation at the green arrow (3C moving higher with price), but again today there's a negative divergence. GDXJ is up over 2% and approaching the resistance area. This is what I think the GLD chart should look like, this makes sense.

 The 1 min action today intraday has been negative, again this suggests that GDXJ may want to pause and consolidate, laterally which is through time or pullback which is obviously through price, either will work (an example of a lateral consolidation would be a rectangle or triangle).

 SLV's 60 min doesn't look as solid as GLD/GDX, but it did put in the same positive divergence at the shakeout, the problem here is SLV HAS hit resistance from last week's highs and there's a negative divergence. Again, this is a 30 min chart and slower to react so it may yet still move in to a position of confirmation as 3C hasn't turned down yet today.

 The 30 min chart shows SLV just above resistance and seeing a negative divergence, 3C to confirm should be at the same level as the red trendline.

 The same problem on the 15 min, although it too has yet to turn down so it may still confirm.

The 1 min chart looks as I would suspect for just hitting resistance, I would think a consolidation would be in order, whether that happens or not, it's hard to say and it could happen above resistance or below resistance.

So there's a bit of a dichotomy as the longer term charts for the most part look pretty good whereas the short to mid term charts don't look as good. GDXJ looks the best as of now.

I'm not seeing enough evidence to suggest these can't move higher, I am seeing some trouble that I don't think should be showing up this early, but SLV reaching resistance may be putting pressure on GLD/GDXJ.

They need to be monitored at this crucial juncture.

One reason I think we are seeing resistance other then the fact there is resistance in the area is the inverse correlation with the dollar.

Here's the dollar intraday.

It fell through the morning lending support to almost all risk assets from stocks to the precious metals, but recently put in a tweezer bottom. Since this capture, the dollar has moved sideways and that is going to put pressure on the commodities incl. the PM's.

I do like the longer term chart's improvement in most cases, it will be a matter of seeing whether it holds .

I think for the moment, the PMs are in an area they may be forced to consolidate.

AAPL Update

As mentioned late on Friday, I decided not to enter AAPL after it saw an 11 point drop and was showing signs of a positive short term divergence in this AAPL Update.


AAPL closed the week with its biggest 2 day drop since November, a shakeout to the upside certainly seemed logical, whereas the dogma of technical analysis would tell you to be all over a short position on a move like that, as I mentioned in the update above, I'd prefer to wait for a better set up and we are seeing that unfolding today.

This was the AAPL 5 min positive divergence posted on Friday, still intraday timeframes and a rather short divergence which would fit with a shakeout move.

To the left is the action from earlier in the week.

As for AAPL today and the longer term....

 There have been warning signals before this leading negative divergence in AAPL on a 60 min chart, I have been warning that something appears to be changing for AAPL, I'll address that on another chart. At last week's Monday/Tuesday highs, AAPL was already in a leading negative position, I don't think it is coincidence that it put in the largest 2 day drop in 4 months this week.


 The 30 min chart shows the same leading negative divergence and perhaps more importantly as far as timing goes, it is in a flat area, almost a H&S type formation. Negative divergences are often seen in flat-ish areas of trade, again I suspect it has something to do with institutional orders being filled near the VWAP.

 Again, the 5 min chart from last week's highs to the lows and the divergence that made me decide to be patient and wait for a better set up in AAPL (short strength, not oversold weakness-although looking at a longer term chart of AAPL, oversold only applies to intraday trends, certainly not to the daily/weekly). At this point, I view AAPL as a short, it's just a matter of the tactical entry, being able to get the best position with the least risk and highest probabilities. If I were a long term investor, a few points here or there probably wouldn't bother me and I'd likely just short AAPL right here and put it away for a while.

 This a.m.'s action on the 2 min chart is showing non-confirmation.

 The 1 min chart is worse, it went negative right at the highs. If it were later in the day and the Q's had moved up decently, I'd probably be looking to short AAPL here, but as it is early and there's still that European closing trend of recent, I will be patient with AAPL.

 Look at the weekly chart, I think I may have posted this (I send a lot of charts via email so sometimes it's hard to remember where I posted what), but the VERY parabolic move that actually started since 2009 has become EXTREME since the start of 2012, everyone knows how I feel about parabolic moves either up or down, they tend to end badly and we have seen the evidence of this on numerous occasions, but this being a weekly chart, it carries special importance toward the longer term trend in AAPL. I want to show you MSFT when it was behaving in similar fashion...

 MSFT weekly chart back in 2000, it also went parabolic and got very volatile toward the end. MSFT declared a dividend after the Tech Bubble popped and MSFT has never seen this kind of growth again, this is what I was talking about earlier, perhaps the trouble seen in AAPL starting several months back might have been dividend related, certainly I think there's a Steve Jobs influence there too, but the point being, these two tech giants look very similar between MSFT in the 90's and AAPL now.

 Since 2012, this 10 day moving average has moved up, it is now moving laterally, something few AAPL longs probably notice as they are more focussed on AAPL new high headlines.

And on a 15 min chart, you can see what does look a lot like a H&S top forming. There are very few "V" shaped reversals, this is a huge market cap stock and they don't usually turn on a dime as institutions have to move positions and huge amounts of shares around. However, the danger as pointed out in the breadth post is the day when it unambiguously cracks. If we saw the biggest 2 day drop in 4 months off some lateral action, when the ice breaks it could be a whole lot worse in a single day and thus we have a term for that, "Bull trap". I can't think of a better stock to set one up in.

Again, for now, I'll be patient with AAPL and se if I can't find a better entry.

Early Market Update

As suspected from this morning's earlier positive divergence in ES, we are seeing some upward movement in ES and a little in the averages. Here's what ES looks like now.

ES working more lie it usually does and calling intraday moves, right now ES is in line after earlier positive divergences I covered pre-market. I've already received several emails of members having made several thousand dollars in closing out some AMZN puts from Friday! Excellent use of the updates!

 Here's the DIA 5 min, I didn't mark the positive divergence, but it was mostly on the 29th, 3C is still trending down, although last Monday saw a much stronger market bounce, this was the same behavior, 3C negative divergences/distribution in to higher prices and non confirmation on the short term charts.

 Here's a 1 min chart, this is non-confirmation.

 The IWM positive divergence last week was a bit stronger then the Q's, but as you can see on the 5 min chart, a leading negative divergence is in  place.

 And non confirmation on the short term charts.

 The Q's had the weakest divergence (5 min chart), they'll need AAPL and the rest of the market to jump start them in my view.
 Short term non confirmation on the opening action

 The SPY showed the best negative divergence Friday, but remember only the SPY and DIA even moved, it is still leading negative here on the 2 min chart so again, no confirmation.

And the 5 min chart started with a negative divergence Friday, that has only gotten worse, thus far this is part of what I expected, although I still did expect to see a sharper, more impressive bounce in price action. The day is still young. We'll look at AAPL soon.

RENN Trade Idea Update (long)

I featured RENN as a trade idea on March 27th last week (long)

Here's RENN Today...

 RENN's Triangle, it's hitting some resistance at the breakout line.

 Here's the reason I liked RENN, a 1 60 min positive divergence in the triangle.

Friday RENN formed a smaller triangle with a 1 min positive divergence so it looks pretty good thus far, hopefully it will blow through resistance and put in some real nice gains. If you need stops for the trade, email me.

Warning For MasterCard / Visa Holders

As you can see by this link in a local newspaper over the weekend, MasterCard and Visa have had over 10 million card numbers breached via a third party that appears to have been hacked. Here's more on the article and what you can do to protect yourself 

I mention this because over the weekend, we had one of our accounts emptied, someone made a copy of my wife's card and used it at a supermarket in another state and nearly drained the entire account. We were warned by Card Security services that criminals are putting magnetic readers on things like gas pumps and suggest you should always pay inside. I'm not sure how our card was breached, but there are also scanners criminals can use and there are specific wallets you can buy for about $10 that protect your card's data. I pass this along to you because even as the money will be replaced, it will take weeks and it's a real pain in the rear.


Overnight/Premarket

I was wrong about overnight sentiment which I thought although there was some slippage, should largely hold up.

Overnight the Japanese Tankan sentiment report was full of exporters worrying over Yen strength, which is a topic I touched on last week as the Yen carry trade is being closed out, the Yen appreciates and the funding for stock purchases disappears.

There was also weak unemployment Eurozone numbers in which it rose. Also French PMI dropped nearly a point from 47.6 to 46.7, the effect on ES-S&P Futures?

To the left is the opening high from last night and pretty much all bad news from there, 3C is showing a positive divergence, lets not forget the strange EU market close effect last week, US stocks weak in the am on a strong dollar and as the EU markets close, the dollar looses strength and they have rallied in to the afternoon, not saying that is what will happen, it was however a notable trend last week.

As of now the markets look to open close to flat so a bounce is still not out of the question, neither is deterioration not only in the EU, the US, but the world's 3rd largest economy, Japan and I doubt anyone really believes the Chinese PMI print.