Monday, April 30, 2012

UNG Update

UNG has been a long term stock of interest, the last update that is fairly comprehensive was from last week, April 23rd. If you are not familiar with the stock and long term trade idea, that's a place to start.

There are many unique characteristics in UNG/Nat. Gas in general and I think the last time I saw something this long, protracted and meaningful was home builders being accumulated during the 2000 Tech bubble sell-off, Wall Street was clearly way ahead of the crowd on those trades that saw long term accumulation of a year or more and incredible moves. Coming right after the "Tech Revolution", who in their right mind would have thought housing was going to lead the next bull market? Wall Street knew and years in advance. I have laid out many of the strange occurrences concerning Nat. Gas, like Bernie's Congressional testimony.

In any case, as a long term trade that probably has a long term secular shift headed its way, Nat Gas / UNG seem to be one of the few stocks out there that seem to be building a huge base.

Here's the update for today as UNG is moving against the FX correlation and the overall market (up in a down market).

 If you look at the last update you'll notice volume is huge lately, you can't see it on this chart as it isn't long enough to show the pick up in volume. The bearish Descending Triangle/Continuation pattern looks to me to be one giant head fake area in which shares of Nat Gas can be accumulated on the cheap, but there have been some recent changes in the trend that are worth keeping a close eye on.


 First the Trend Channel which has held the move below support is now broken-this is the daily chart, so it's a significant break suggesting the down trend since breaking below the triangle is over. The stop area on a long position is around the red box, although I look at this as a long term secular change and it may be worth having  smaller position size and a wider stop to counter volatility/noise.

 In the VERY near term, UNG has run in to a head fake upside move which is acting as resistance, the head fake move is at the green arrow, note the price spike and reversal-again we almost always see some sort of head fake on every timeframe before a reversal in trend, it i that way because the head fake provides momentum to the reversal. So on the 1 min chart we are seeing some profit taking most likely in anticipation of a slight pullback or maybe consolidation.

 The longer term trend on the 5 min chart looks excellent, it is leading positive here. So I doubt there's going to be much more than a pullback or consolidation.

 Here's the move below support on a 30 min chart, as I suspected, it looks like all of the stops/shorts, etc were accumulated as this 30 min positive divergence looks very strong.

The 60 min long term relative divergence is huge, o we may in fact be seeing the start of a move toward the upside in UNG/ Nat Gas that will break out back above where support initially failed. This appears to be a huge stage 1 base, stage 2 mark up would be significant on a base this large.

PCLN Update

On Friday I added a bit to the model portfolio EQUITIES PCLN short position, here is Friday's PCLN update as PCLN is in the target zone.

As you know, since we have been in the volatility shore break zone with few trends lasting more than 1-3 day, I had been using options for short term trades of 1-3 days, in effect using the volatility to add to profits in trades that otherwise wouldn't have been worth the risk:reward relationship. About  a month ago I started building equity short positions rather than using leverage and the transition has accelerated to very few leveraged trades and trying to short strength wherever possible, but leaving plenty of room for a stop and to add, PCLN on Friday was an add to position which wasn't very big as I'm tech heavy right now. However it is still looking like a good set up and for whatever reason, this seems to be the 1 stock that I get the most emails about with regard to shorting it. What did PCLN do to you guys that you hate it so much? :) LOL!. Wherever there's money, I'm in for the trade. The reason for moving toward equity shorts and away from options is because I believe we are on the edge of a downtrending market, I don't want expiration concerns and I don't think I need the leverage although it served me/us well. I think it is just choosing the right trade for the market conditions.

 Since April 10th, PCLN has broken through all 3 of our upside targets offering many opportunities to phase in to this trade and short on strength rather than chasing a downside move. The final target area is a new high around the yellow area as posted Friday and in numerous other updates, this would be the best looking entry from a risk perspective and a bull trap/downside momentum perspective.

If I could access the model portfolio (there having some site issues today), I'd be considering adding one last position in PCLN on a break to a new high, as mentioned already though, I'm a bit heavier in Tech than I would prefer.

 This morning the stop were hit o a move below local support -see volume under support, this looks to have been a planned shakeout to boost PCLN.

 Friday 3C 1 min was leading negative in that support area suggesting short term they were positioning PCLN to break support in red, the market obviously helped out. The chart quickly jumped back in line after that break.

 As to the trend locally, strength is being sold/shorted.

 The 3 min chart with less noise shows this more clearly as PCLN is leading negative on this most recent move. Note how distribution starts slowly as to not knock the price down by selling / shorting too much and then accelerates in to higher prices.

 The 15 min chart is where we really start to care about what is going on in the longer term trend, you clearly see strength being sold for some time, it takes some time to reverse positions for large Wall Street funds, it can't happen in a day like we can trade. You also see the April 24th Tech rotation we identified before AAPL earnings after market the 24th, look at the divergence (negative) since April 24th, deeply leading negative, ugly chart for PCLN.

 The even more important 30-60 mi charts confirm the longer term trend as PCLN is seemingly dumped by hedge funds and institutional money everywhere as well as insiders I presume by the looks of the overall insider transactions.


I obviously like PCLN right here, but  break to a new high  (closing would be best) would certainly attract my attention and I'd probably add 1 more time. At least I have a decent position built there already.

Full market update

 Earlier I mentioned a "U" shaped reversal to the upside was unlikely, a "W" shaped move would be more in keeping with what we normally see, the SPY has traced out such a pattern, interestingly for the intraday momentum traders it has also thrown up a bearish descending triangle, this is taken by technical traders to be a bearish continuation pattern from the preceding trend and on this timeframe the trend was down, so shorts will pile in to this pattern based on that alone. A head fake move that breaks lower support would draw even more in and can't be ruled out, but what I was expecting to see based on the break of support, the volume surge and the early 3C charts, thus far is playing out. A breakout to the upside on this triangle is what we would be looking for as to that one last blow-off upside move. We have 5 points of contact in the triangle and the apex is almost complete so a directional move should be coming soon.

 The  1 min chart continues to be positive in the SPY, now leading positive.

 That strength on the 1 min has bled to the 2 min which is also leading positive here, it appears the busted stops were accumulated. Usually after 12 p.m. or the Euro close we see some dollar weakness and that gives the market some upside breathing room.

 The 5 min chart is by no means bullish at all, scaled out correctly it is leading negative, but there is a mall intraday relative positive associated with the 1-2 min charts bleed through.

 Recently underlying trade in the DIA and IWM has looked the worst, we have a decent enough 2 min positive divergence in the DIA which is very close to moving to a leading position, in fact I just checked and since this capture it is leading positive now (3C has made a high above the white trendline).

 The 5 min chart is simply in line with price, that may change if the 2 min keeps growing.

 Look at the 30 min DIA-this is the longer term trend and the most important of the above DIA charts, we expected distribution in to higher prices, that is what we have, this is deeply leading negative for a 30 min chart and very quickly. It is VERY IMPORTANT to realize that the cliff holding the market HAS broken, this is the most difficult time to get exact tops as this is already more than negative enough to send the market lower. However the trend in the market has not been one in which the market easily tells you what it will do in the near term and  head fake upside move to possibly  new high before a reversal is still the highest probability based on market action. Almost no reversal takes place without a head fake move first and that applies to EVERY timeframe from 1 min to daily.

 Remember the quiet market in ES last night and what I said about it? Here ES goes negative at the EU open, I suspected that was where we's see some action in ES overnight. Since that negative divergence ES was in line with price (green) and now we have a 1 min positive divergence which looks again like Wall Street has stepped in with some support to counter the Chicago PMI and rotten EU data that is creating a head wind against Wall Street's attempt to set the bull trap with a move higher. This is about the 4th time we have seen this in the last week and it is not something we see often.


 As mentioned above the IWM's underlying trade has been some of the worst, however it too has a 1 min positive here as a flat range is carved out.

 The 2 min looks horrible on the whole, yet we have a positive divergence intraday today.


 The 5 min is in leading negative position overall, but again a positive divergence intraday, there's a difference between the trend of 3C and intraday movement, the intraday movement suggest Wall St. is fighting for the blow off move higher, the trend in 3C has shown they have been selling in to every bit of strength they can and only stepping in with minimal support when absolutely needed.

 The IWM 15 min is starting to look like the DIA 15 min as of Friday when it started to lead negative only to see that divergence deepened dramatically in the afternoon.

 QQQ 1 min has seen some positive intraday divergence as well, including a brief leading move earlier.

 The 5 min also looks horrendous, but the intraday positive is there.

The 15 min is also just starting the same move as the DIA Friday.


We are definitely in the red zone here, I am still trying to be patient and watch the underlying trade in the market, but if I were to take a position and not look at it for a month, I would have no problem shorting the market any where in this area.

Notes on PMI-Dallas F_E_D

I suspected from the start of the year all of the economic reports were being heavily massaged by arbitrary seasonal adjustments, they should just stick to 1 set of rules, instead (probably because of an election year), they grabbed whatever number they wanted and then fit the seasonal adjustment to justify it, although I can't rule out a larger Wall Street move up which they needed to unload as the breadth charts make clear they were doing the entire time.


Take a look at the Citigroup Surprise Economic Index this tells the story of what happens when seasonal adjustments are no longer there to mask the data.


As for the Chicago PMI (and consider the market action thus far this morning and what I said last night about "once Wall Street starts a cycle, they are pretty darned sure to finish it no matter what is thrown in their way', for instance the data out of Europe this morning and the US, in any naturally discounting market, we'd be off -2% right now.


The headline number and the size of the miss were both the worst showing since 2009! 


The Dallas F_E_D Manufacturing Index missed as well, this is the first negative print in the index for the year, it is also the biggest drop in seven months and the worst miss in 10 months. The drop from +10.8 to -3.4 is also the largest sequential drop in 11 months. 


The US is not dislocating from the world economy as many economists have been arguing, it is lagging the world economy and likely because of the massaging of the numbers in an election year.

However, don't discount the QE crowd just yet, they will turn any negative print in to a market positive on the hoped of more QE, which is something we will discuss in further detail later.

For now though, the trend in the macro economic data is clear, it seems it's not only price that is deceptive, but the Macro data in general that pushed the market higher this year on seasonal adjustments that no one could justify. All you had to do was look beyond the headline number at the sub-indicies in the reports to see they were bunk, or watch credit markets or market breadth.

SPY Update

For the most part the SPY doesn't look much different than AAPL this a.m. Pretty much all the same concepts apply, however as mentioned last week and for some time, I do think this is the last bounce for the market before cracking, I would say the cliff edge has already broken, Wiley Coyote just hasn't looked down yet.

The SPY daily chart obviously isn't off to a stellar start this a.m., however with recent volatility it can't be considered down and out of the game just quite yet, although I have been shorting in to strength for the model portfolio wherever I can find it. The point is, the recent volatility is so high, a move above the recent highs (above $1400 SPX) still can't be ruled out and psychologically it would be the best bull trap set up before a reversal.

Note the SPX/SPY, even after the horrible PMI this a.m. just dipped enough to take out recent support and trigger a boat load of stops with some short sellers jumping in no doubt, the volume tells the tale. As I said with AAPL, a 'U" shaped intraday reversal would not be likely, some sideways or 'w' shaped price action would be more likely to allow accumulation to take place, with positions as large as Wall Street is running, they need some time.


 The first pos. 1 min divergence has now formed a second on the 1 min chart.

 This is now showing on the 2 min chart as a stronger 2 min divergence as the 1 min "relative" strength bleeds over to the next longest timeframe.

This 15 min chart is where we really want to keep a close eye, it is already divergent enough to say the cliff has broken, I think now it's simply about how the tactical reversal goes down, my vote right now is still for  last volatility blow off move to the upside.

AAPL Update

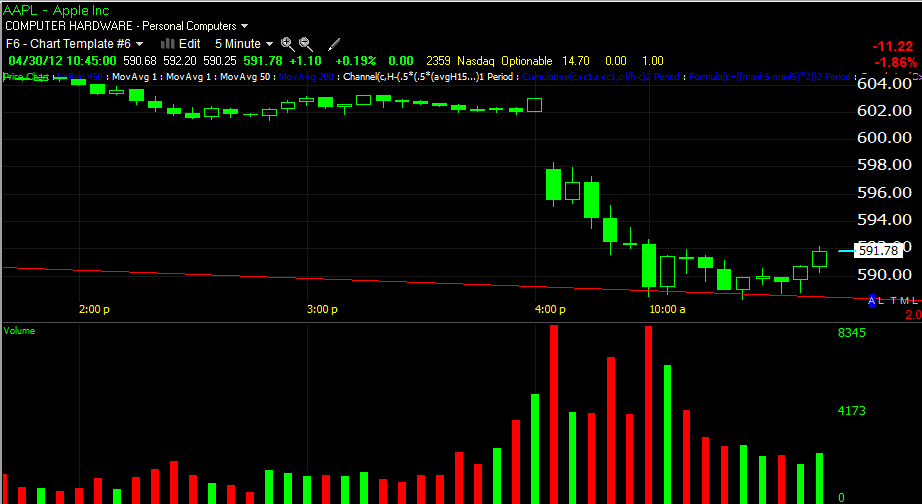
 This is the daily AAPL chart, the upper trendline of this triangle is what we wanted to see broken to the upside after AAPL's horrible performance in the early part of the move off the April 10th lows, it's also finding some support in the area.

 On a 15 min chart you can see the huge number of stop hit on this morning's move down, this would give Wall Street a chance to accumulate those shares for one last blowoff top without arousing too much suspicion as someone has to take the other side of the trade. Note again some support in the area of the descending trendline.

 On a 5 min chart, it looks like more support. I would think that a "U" reversal straight up from here would be difficult, but I suppose they don't need that many shares to get AAPL to pop one more time, it's just not a typical reversal pattern, usually I'd expect to see another move lower and a small "W" bottom or maybe even a brief break through that support trendline. Almost every reversal is preceded by a head fake move on any timeframe chart.

 The 1 and 2 min charts still haven't confirmed the downside move and have had plenty of time now.


 The relative divergence that I wanted to see hold up on the 5 min chart in the last AAPL post, thus far is doing that, we'll see if it can continue to hold, this would be bullish for AAPL to stage one last blow-off move as the 1-2 min charts imply.

Don't lose sight of the bigger picture though, the 60 min chart, AAPL is in big trouble here. I'll add to the position on a blow off move higher.

AAPL Update

Early trade is always deceptive, especially on Monday as traders/investors who have real jobs place limit orders and stops and the market spends the first hour or so running them every which way. The European data overnight is seemingly starting to stink a bit more than it did earlier, Portugal looks like it will need another bailout and probably a Greek-style debt restructuring, you remember what we talked about with regard to how the EcB created a subordinated bond market when they accepted the new Greek bonds with no haircut like everyone else and how I thought that would come back to bite them in the butt, well Portugal may test that theory.

However the market didn't really sink much more on the very ugly Chi-town PMI data so they are still running the a.m. games and possibly still the volatility shakeout (the larger one).


As for AAPL, the market's last chance as it is really starting to fall apart now...

 The Friday positive divergences on the 1 and 2 min charts above and below are still intact, the drop in AAPL was NOT confirmed on the early charts.


Whether this 5 min which shows the distribution of the AAPL gap up can hold a relative positive divergence we will see shortly.

The SPY needs to hold in the area of this a.m.s lows and put in a stronger ivergence than the initial one today

QE Crowd or Volatility shakeout move?

 Since the break of support came before the PMI data, unless it was... you know what, and volume was large before the PMI, this looks like a shakeout of early day trader/momentum shorts being shaken out.

There's a small positive divergence right under support, I'm sure the QE crowd isn't hurting either right now, lets see if this divergence goes anywhere on  pullback or just tries to head for the gap.

Chicago PMI

Released On 4/30/2012 9:45:00 AM For Apr, 2012
PriorConsensusConsensus RangeActual
Business Barometer Index - Level
62.2 60.8 58.0  to 62.9 56.2 


Well if that isn't a miss, I'm not sure what is, the print is below the bottom range of consensus. Now to see if the QE crowd takes bad news and turns it in to good news.

Chicago PMI in minutes

Should make for some volatility